Columns: buckling, eccentric reactions and combined forces
1. Effective length and slenderness: how slender is the column? Always examined
Simple explanation: Why a long column can fail before crushing
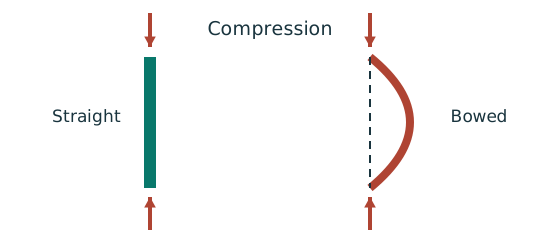
Push a long thin ruler from both ends: it may bow sideways first.
- Find effective length and radius of gyration for each axis.
- Calculate slenderness for both directions.
- Use the appropriate buckling curve before forming resistance.
Remember: Compare the final resistances; slenderness alone may not identify the controlling axis.
. The radius of gyration says how far the steel sits from the bending axis — the more spread out, the larger , the smaller and the harder the column is to buckle. A tie in the weak direction can halve the weak-axis effective length and raise the capacity without changing the section, but it only helps in the direction it actually holds.
| Idealized restraint pattern in Table 8.6 | Theoretical | Recommended when ideal conditions are approximated |
|---|---|---|
| Both ends fixed against rotation and translation | ||
| One end fixed, other pinned; translation prevented | ||
| One end fixed, other rotation-fixed but translation-free | ||
| Both ends pinned, translation prevented | ||
| Fixed-free cantilever | ||
| Source sixth pattern with partial rotational restraint and free translation at top | Not specified |
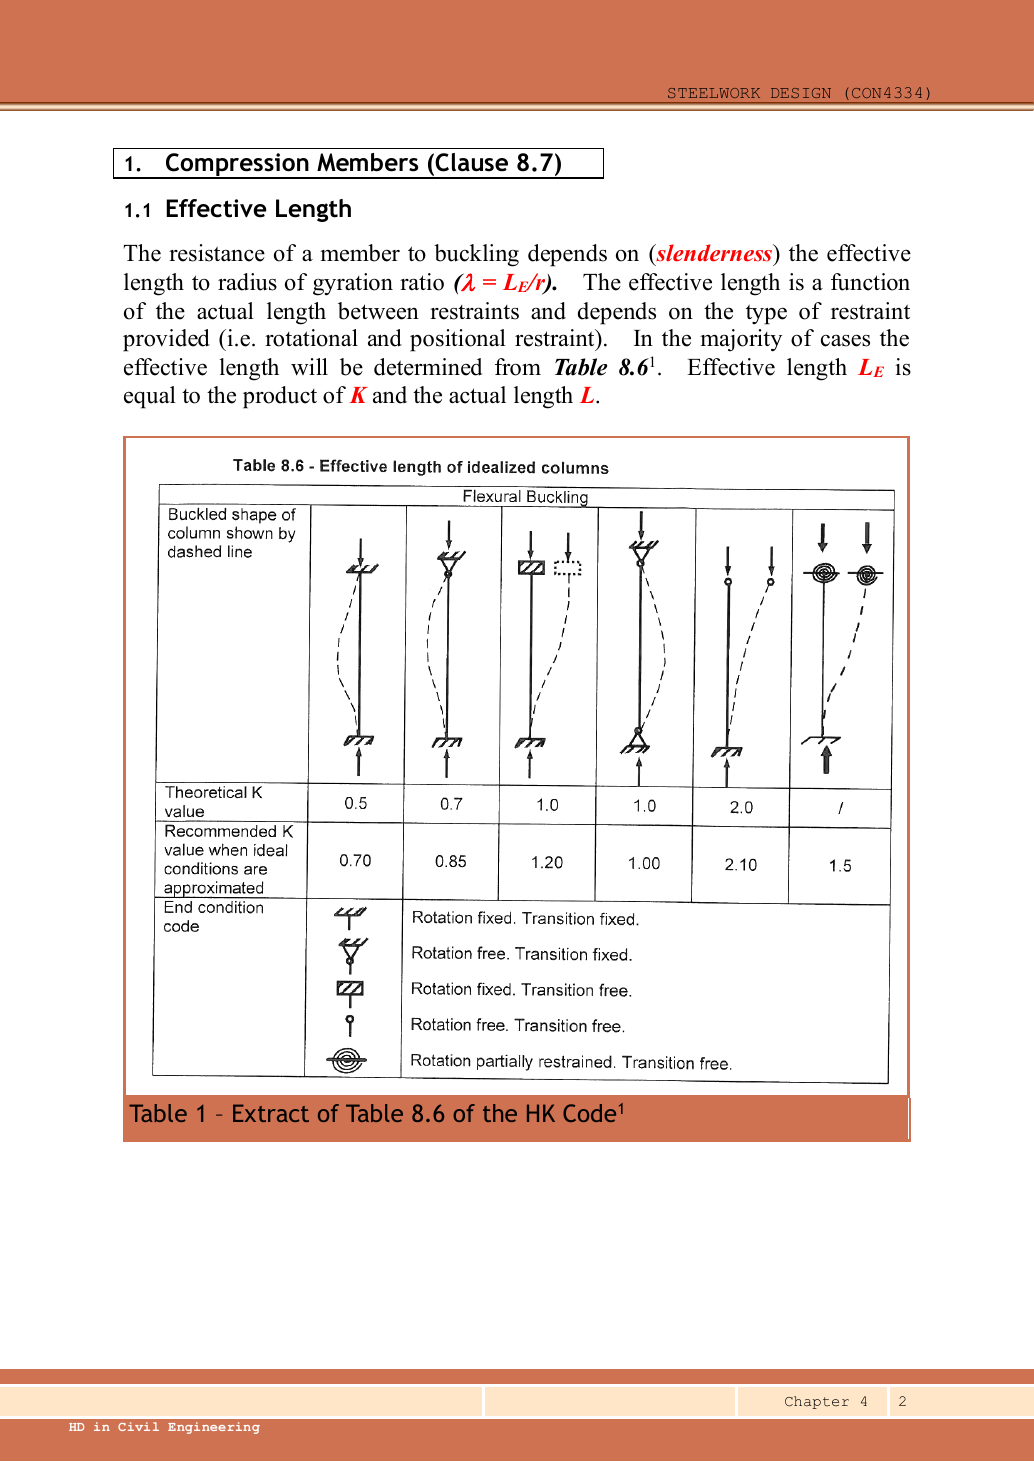
If the question gives the effective length, use it (2022–2024 all did). Otherwise choose the recommended factor in the table above for the end conditions (e.g. 0.70 for both ends fixed, not the theoretical 0.5). A pin symbol means free to rotate, not free to sway. Keep and in the same units (the table gives in cm; ×10 for mm).
Try it yourself. A6 m pinned column has a midheight tie effective only against weak-axis buckling. Find Lᴱx and Lᴱy.
Reveal answer and reasoning
; . Major-axis buckling can still extend over the full height.
Animation labEffective length and buckling axes
Supplement to the original lesson. Enable JavaScript to play, step through calculations and rotate 3D models. The following explanation remains readable offline.
- A column can bow sideways before its section reaches the crushing resistance.
- Each axis has its own radius of gyration and restraint spacing.
- , with compatible length units. A tie affects only the directions it actually restrains.
- Select each buckling curve and compressive strength before forming Pc. The governing axis is determined by resistance, not slenderness alone.
Concept map: Column buckling: why a long column bows out before it crushes
Concept map
Column buckling: why a long column bows out before it crushes
The column question’s , , strut curves and all come from one idea: a column is never perfectly straight, and compression makes the bow grow. This map links those words.
- Cause
- Key idea
- Result
- What changes it
- How design deals with it
- Exam answer
- marks are often lost here
Text version (from cause to result)
What changes it
How the ends are held
Fixed ends make bowing harder than pinned ends. A pin symbol means free to rotate, not free to sway.
Comes from (upstream)— (a starting point)
Leads to (downstream) Effective length
How design deals with it
A tie in the weak direction
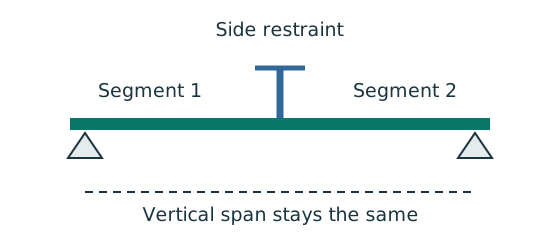
A tie at mid-height in the weak direction can halve the weak-axis effective length and raise the capacity without changing the section — but only in the direction it actually holds.
Comes from (upstream)— (a starting point)
Leads to (downstream) Effective length
Cause
Axial compression
The column carries the compression coming down from the floors above.
Comes from (upstream)— (a starting point)
Leads to (downstream)Compression makes the bow grow
Cause
No column is perfectly straight
Real columns have an initial bow. Design assumes it from (curve a₀) to (curve d), depending on the strut curve.
Source: Introduction lecture §14: imperfections
Comes from (upstream)— (a starting point)
Leads to (downstream)Compression makes the bow growSection shape → strut curve a/b/c/d
What changes itWhere marks are lost
Effective length
Turns the end conditions into an equivalent buckling length. For both ends fixed use the lecture’s recommended 0.7 (not the theoretical 0.5). If the question gives the effective length, use it.
Comes from (upstream)How the ends are heldA tie in the weak direction
Leads to (downstream) Slenderness: how slender it is
What changes it
Radius of gyration: how far the steel sits from the axis
The further the steel is spread from the axis, the larger and the harder it is to bow. Each section has two: a large and a small .
Comes from (upstream)— (a starting point)
Leads to (downstream) Slenderness: how slender it is
Key idea
Compression makes the bow grow
The compression acts through the bow and adds a moment that bends the column further — the member’s P–δ effect.
Source: P–Δ and P–δ concept map
Comes from (upstream) Axial compressionNo column is perfectly straight
Leads to (downstream) It buckles before it crushes
Key ideaWhere marks are lost
Slenderness: how slender it is
Combines length and stockiness into one number. The larger , the easier it buckles. Work it out for each axis separately.
Comes from (upstream) Effective length Radius of gyration: how far the steel sits from the axis
Leads to (downstream) It buckles before it crushes
Result
It buckles before it crushes
A long slim column fails sideways before the steel yields, so its design strength is below ; the more slender, the smaller . Only a short stocky column gets close to crushing ().
Comes from (upstream)Compression makes the bow grow Slenderness: how slender it is
Leads to (downstream) Read p_c, the weaker axis governs
What changes it
Section shape → strut curve a/b/c/d
Sections of different shape and thickness are more or less sensitive to imperfections, hence four curves. UC: b about , c about ; UB: a about , b about . The curve does not depend on the steel grade.
Comes from (upstream)No column is perfectly straight
Leads to (downstream) Read p_c, the weaker axis governs
How design deals with it
Read p_c, the weaker axis governs
Interpolate in Table 8.8 with , using the right curve and column, then multiply by the area for . Do both axes; the smaller governs. Worked numbers: column calculation map.
Comes from (upstream) It buckles before it crushesSection shape → strut curve a/b/c/d
Leads to (downstream)Exam: both axes, both curves
Exam answerWhere marks are lost
Exam: both axes, both curves
Write , which curve each uses, both interpolations and both — every line earns marks.
Comes from (upstream) Read p_c, the weaker axis governs
Leads to (downstream)— (the last step)
Tour steps
1. The cause: compression + not straight
A real column has an initial bow; the compression acts through it and makes the bow grow.
In this step Axial compressionNo column is perfectly straightCompression makes the bow grow
2. Length and stockiness
End conditions → effective length; how far the steel sits from the axis → ; together they give .
In this stepHow the ends are heldA tie in the weak direction Effective length Radius of gyration: how far the steel sits from the axis Slenderness: how slender it is
3. Buckling before crushing
That is why a long column’s design strength is below .
In this step It buckles before it crushes
4. Curves and the table
The section shape picks the curve; + curve + column → → .
In this stepSection shape → strut curve a/b/c/d Read p_c, the weaker axis governs
5. In the exam
Two axes, two curves, two values.
In this stepExam: both axes, both curves
Animation labEffective length and buckling axes
Supplement to the original lesson. Enable JavaScript to play, step through calculations and rotate 3D models. The following explanation remains readable offline.
- A column can bow sideways before its section reaches the crushing resistance.
- Each axis has its own radius of gyration and restraint spacing.
- , with compatible length units. A tie affects only the directions it actually restrains.
- Select each buckling curve and compressive strength before forming Pc. The governing axis is determined by resistance, not slenderness alone.
2. Choose the buckling curve, then read Always examined
Simple explanation: A table lookup needs several keys
A table is like an address: knowing only the street is not enough.
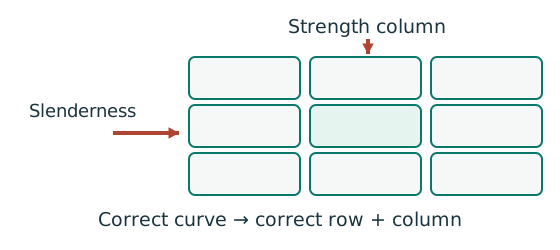
- Select the curve using section type, thickness and axis.
- Select the material-strength column.
- Bracket the slenderness and interpolate if required.
Remember: Do not jump between steel grades or extrapolate past supplied data.
First confirm the section is not slender. Under pure compression the lecture checks flange and web ; if both pass, the full section may be used. (That only rules out Class 4; it does not prove Class 1. For classification when the column also bends, see the columns crash course.)
| Section; maximum thickness | Curve about | Curve about |
|---|---|---|
| Rolled I; | ||
| Rolled I; | ||
| Rolled H (UC); | ||
| Rolled H; | ||
| Welded I or H; | ||
| Welded I or H; |
The table above is Table 8.7 on Data File p.7. The two rows used most in exams: UC (rolled H) → curve b about , c about ; UB (rolled I) → a about , b about (thickness ≤ 40 mm). The curve depends on the section shape and thickness, not on the steel grade.
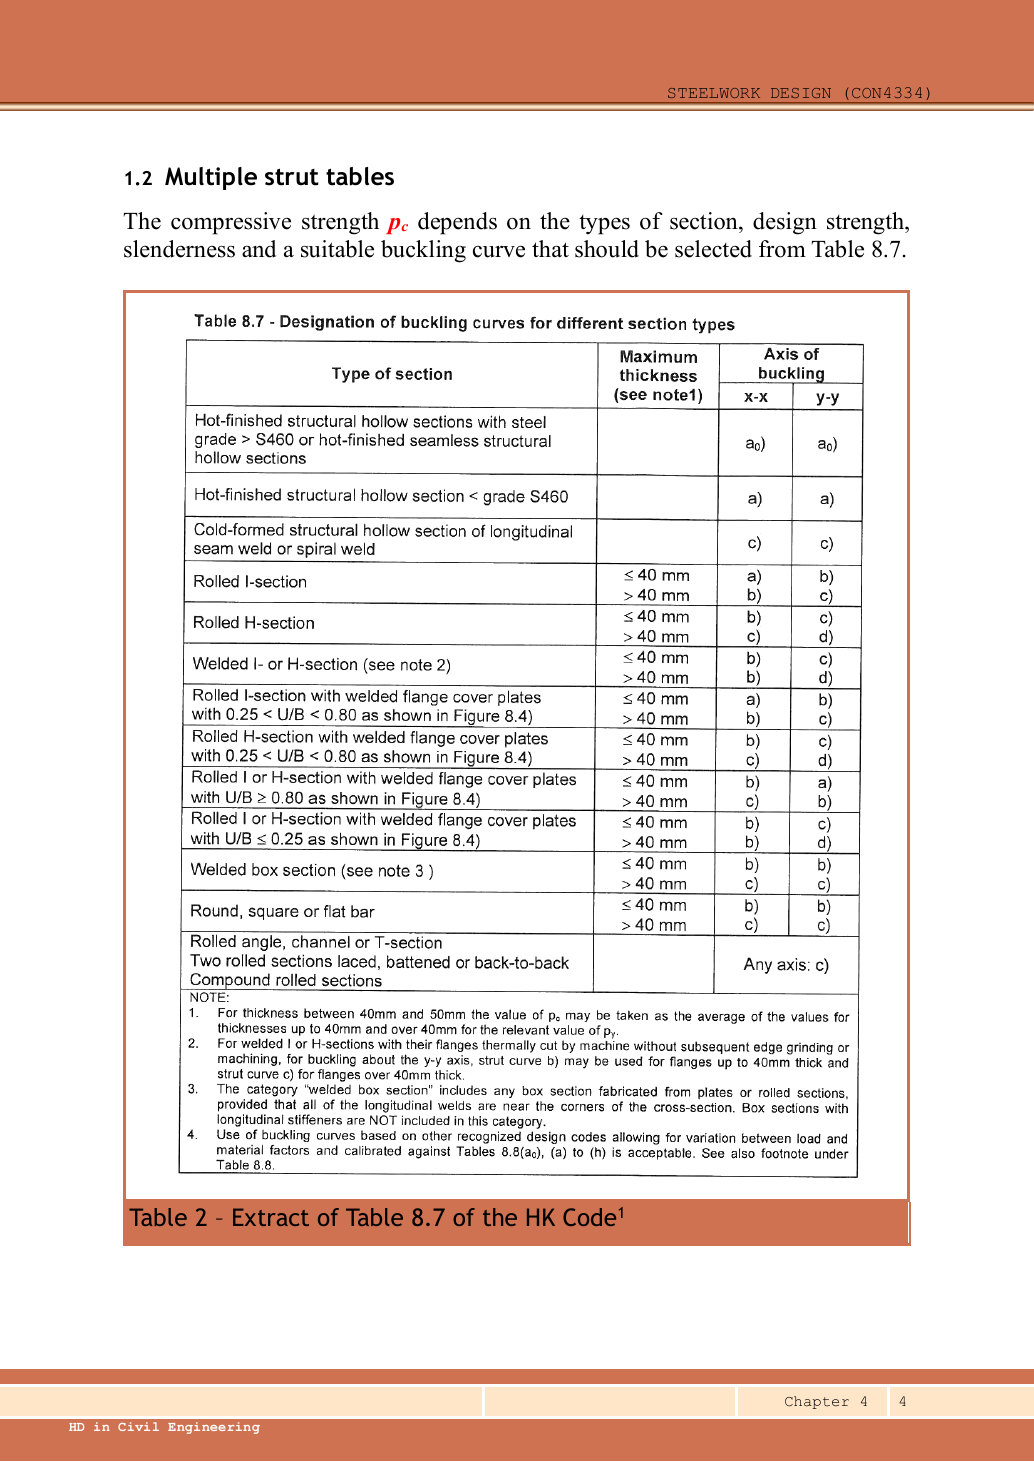
Hot-finished structural hollow sections in steel above S460, or hot-finished seamless hollow sections: /. Hot-finished hollow sections in steel below S460: /. These two source rows say “above” and “below”; neither explicitly assigns exactly S460, so do not invent an equality boundary. Cold-formed hollow sections with longitudinal or spiral welds: /.
Hot-rolled I-sections: thickness uses /; uses /. Hot-rolled H-sections: for the same two thickness intervals, use respectively / and /. Welded I/H-sections: use respectively / and /; also see note 2.
Hot-rolled sections with welded flange cover plates: select the row using the Figure 8.4 ratio . When : for I-sections in the two thickness intervals above, use respectively / and /; for H-sections, use respectively / and /. When : for I/H-sections, use respectively / and /. When : for I/H-sections, use respectively / and /.
Welded box sections: for the two thickness intervals above, use respectively / and /; also see note 3. Round, square or flat bars: use respectively / and /. Hot-rolled angles, channels and tees; two hot-rolled sections connected by lacing, battens or back to back; and built-up hot-rolled sections: for either axis, use .
Note 1: for thickness to , for the same relevant , average the values for thickness not exceeding and thickness exceeding of . Note 2: for welded I/H-section flanges machine flame-cut without subsequent edge grinding or machining, when buckling about the axis, flange thickness not exceeding may use curve ; above that thickness, use . Note 3: “welded box sections” includes boxes assembled from plates or hot-rolled sections with all longitudinal welds near the corners, but excludes boxes with longitudinal stiffeners. Note 4: the source permits curves from other recognised codes when differences in load/material partial factors are addressed and the curves are calibrated against Tables 8.8(a₀), (a) to (h); the Table 8.8 footnote also applies. This does not supply numerical values that can simply be mixed with the course tables.Open full-size image
- From the section type and maximum thickness, choose the curve for each axis (UC: , ).
- Find from the grade and thickness, and use that column in the curve’s Table 8.8.
- Work out for that axis, find the two rows either side and interpolate .
- and ; the smaller one is .
Work out both axes even if is smaller: the effective lengths and curves may differ, and the weaker axis controls. Always interpolate within the table; never guess from the trend.
Column example 1: a pinned column in axial compression
Open this example on its own page
Select a Grade S355 UC for a column pinned at both ends, carrying a design axial compression of . Check the selected section’s compression resistance.
Original source: LectureNotes/Ch 4_Column.pdf — p. 21, p. 22. Values tagged given are in the question or diagram; lookup values come from a named table; calculated values follow from the working; assumptions are stated explicitly.
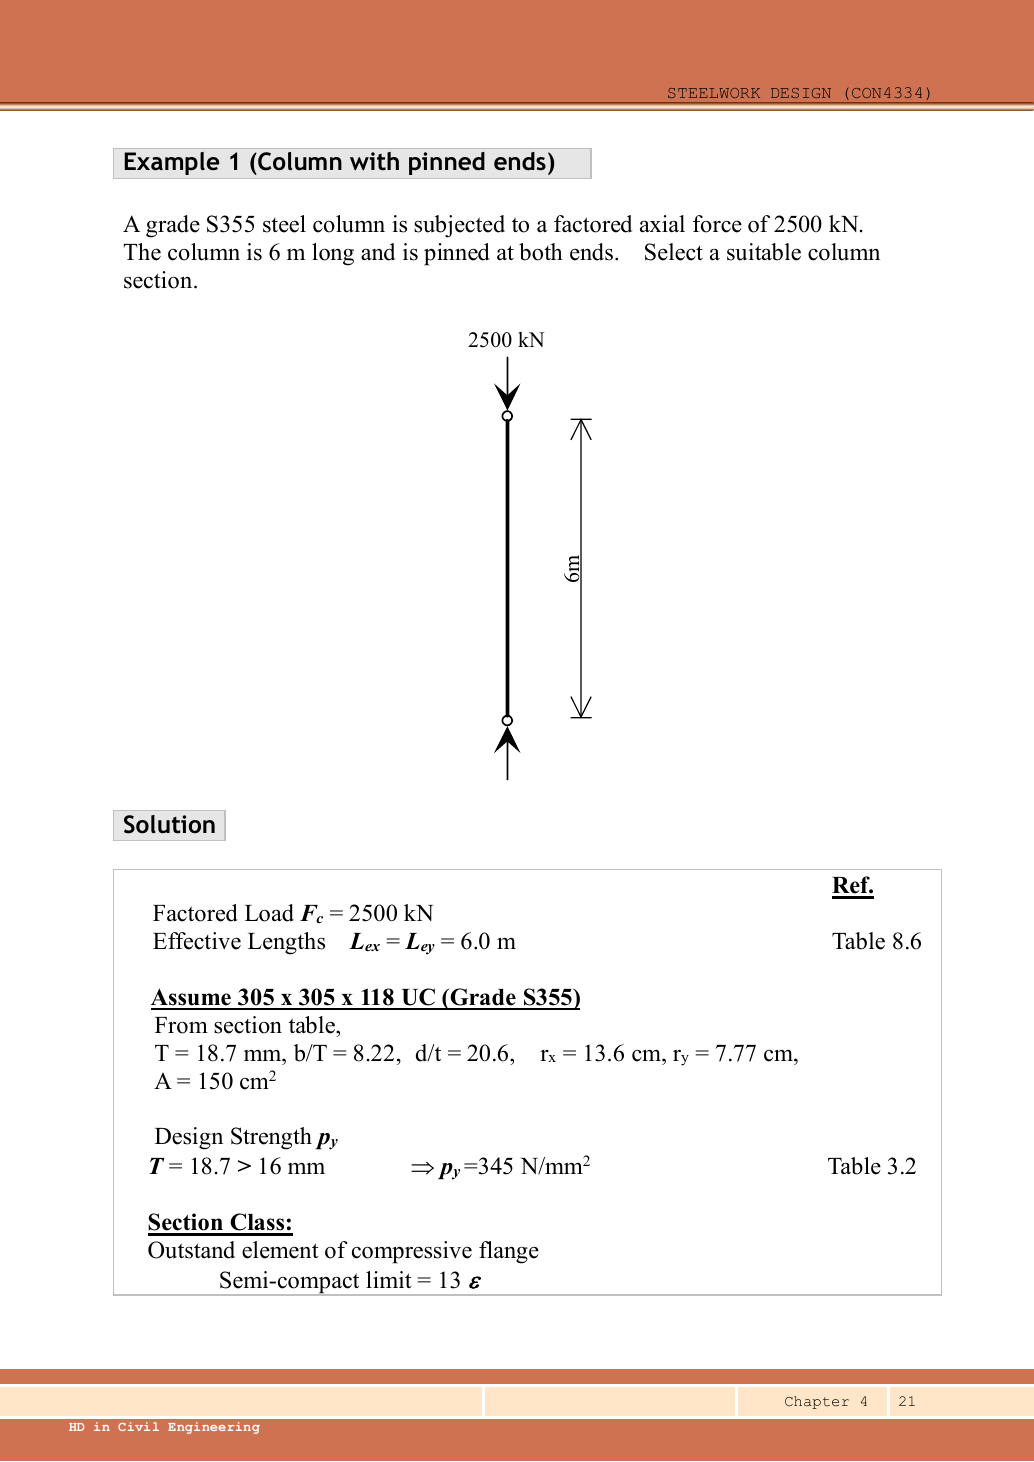
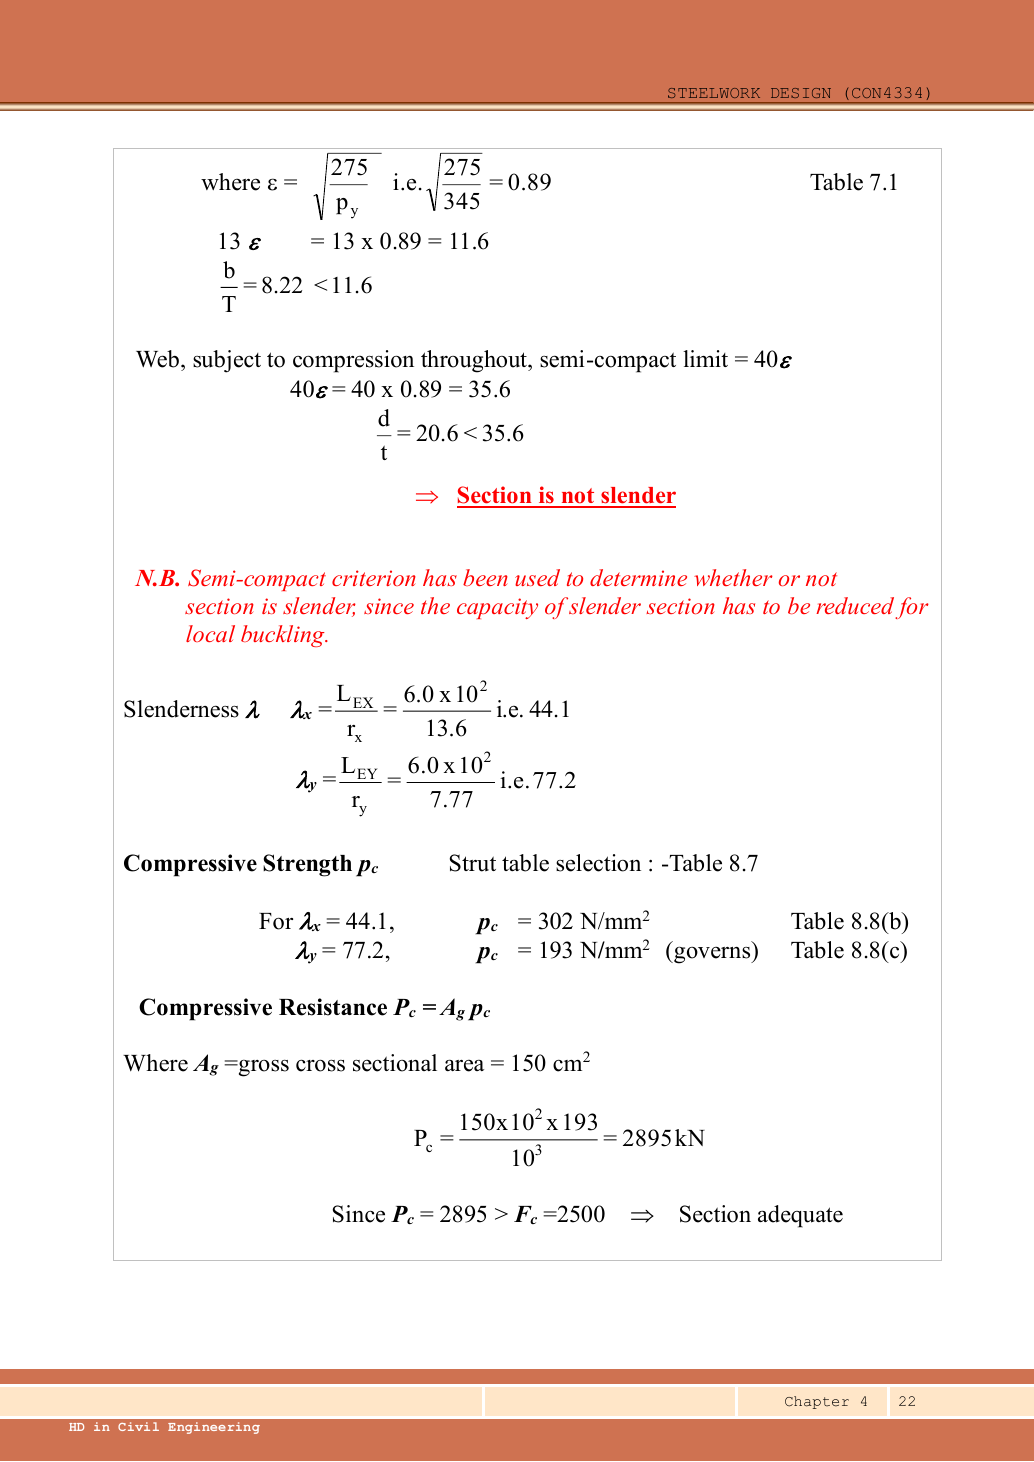
Read the diagram and collect the data
| Input | Source and meaning |
|---|---|
| Design load | Given , already factored; no dead/imposed breakdown is needed. |
| Restraints | Pinned-pinned, translation prevented at ends; Table 8.6 gives in both axes. |
| Selected row | Data File p.11, UC: flange , , , , , . |
| Strength and curves | S355,, giving . Hot-rolled H-section, , so axis uses curve b; axis uses curve c. |
Before calculating: recognition and strategy
There is no stated bending moment, so the core numerical task is axial member buckling. First ensure the local plates are not slender, allowing gross area. Then calculate both axis slendernesses and select the correct curve for each. The area alone is not enough: a long weak column can buckle well before reaching A𝗀pᵧ.
1. Choose a section and confirm its strength
The lecturer selects a trial UC. Its nominal mass is part of the section designation. The strength calculation uses the tabulated gross area . The flange thickness is , falling within the S355 thickness band .
exceeds the load but is not the member resistance. Proceed to local-slenderness and overall-buckling checks.
Animation labEffective length and buckling axes
Supplement to the original lesson. Enable JavaScript to play, step through calculations and rotate 3D models. The following explanation remains readable offline.
- A column can bow sideways before its section reaches the crushing resistance.
- Each axis has its own radius of gyration and restraint spacing.
- , with compatible length units. A tie affects only the directions it actually restrains.
- Select each buckling curve and compressive strength before forming Pc. The governing axis is determined by resistance, not slenderness alone.
2. Establish a non-slender section
Simple explanation: A thin part can wrinkle first
A thin plate may wrinkle before the whole steel member reaches its intended resistance.
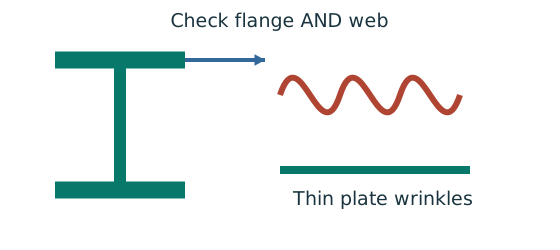
- Check flange and web slenderness using their own definitions.
- Compare each ratio with the correct class limits.
- The less favourable element determines the section class.
Remember: Bending limits and uniform-compression limits are different.
This establishes Class 3 or better, not necessarily a plastic flange. The pure-compression example does not need plastic bending resistance; checking the non-slender boundary is sufficient for its stated method.
Animation labWhy thin elements buckle locally
Supplement to the original lesson. Enable JavaScript to play, step through calculations and rotate 3D models. The following explanation remains readable offline.
- The flange outstand and web have different widths, thicknesses and edge support conditions.
- A thinner plate can wrinkle locally before the complete member loses stability.
- Class 1 allows plastic rotation; Class 2 reaches plastic resistance; Class 3 reaches elastic resistance; Class 4 requires effective properties.
- Check every relevant compression element with the supplied limits and stress distribution. The deformation shown is qualitative.
3. Calculate slenderness about both axes
Simple explanation: Why a long column can fail before crushing
Push a long thin ruler from both ends: it may bow sideways first.
- Find effective length and radius of gyration for each axis.
- Calculate slenderness for both directions.
- Use the appropriate buckling curve before forming resistance.
Remember: Compare the final resistances; slenderness alone may not identify the controlling axis.
The smaller weak-axis radius makes its slenderness much larger. Still read both curves rather than assuming the larger slenderness by itself proves which resistance controls.
Animation labEffective length and buckling axes
Supplement to the original lesson. Enable JavaScript to play, step through calculations and rotate 3D models. The following explanation remains readable offline.
- A column can bow sideways before its section reaches the crushing resistance.
- Each axis has its own radius of gyration and restraint spacing.
- , with compatible length units. A tie affects only the directions it actually restrains.
- Select each buckling curve and compressive strength before forming Pc. The governing axis is determined by resistance, not slenderness alone.
4. Read and interpolate the two compressive strengths
Simple explanation: A table lookup needs several keys
A table is like an address: knowing only the street is not enough.
- Select the curve using section type, thickness and axis.
- Select the material-strength column.
- Bracket the slenderness and interpolate if required.
Remember: Do not jump between steel grades or extrapolate past supplied data.
Table 8.7, rolled H section with maximum thickness : uses 8.8(b), uses 8.8(c). In each use the pᵧ=345 column of Data File p.8.
The source rounds these to and . The minor axis has the smaller and controls for the same area.
Animation labEffective length and buckling axes
Supplement to the original lesson. Enable JavaScript to play, step through calculations and rotate 3D models. The following explanation remains readable offline.
- A column can bow sideways before its section reaches the crushing resistance.
- Each axis has its own radius of gyration and restraint spacing.
- , with compatible length units. A tie affects only the directions it actually restrains.
- Select each buckling curve and compressive strength before forming Pc. The governing axis is determined by resistance, not slenderness alone.
5. Form resistances and conclude
Using the lecturer’s rounded gives , agreeing with the original answer. The governing failure mode is minor-axis overall buckling, not yielding of the full gross area.
Animation labEffective length and buckling axes
Supplement to the original lesson. Enable JavaScript to play, step through calculations and rotate 3D models. The following explanation remains readable offline.
- A column can bow sideways before its section reaches the crushing resistance.
- Each axis has its own radius of gyration and restraint spacing.
- , with compatible length units. A tie affects only the directions it actually restrains.
- Select each buckling curve and compressive strength before forming Pc. The governing axis is determined by resistance, not slenderness alone.
Compact exam answer
Select S355 UC; , giving . ,, non-slender.,,. Curves b/c give respectively , . , adequate. Rounded source result .
Mistakes to avoid
- Do not use solely because the steel is S355.
- Do not halve the effective length just because both ends are supported.
- Do not use the same strut curve for both UC axes.
- Do not treat the lower reaction arrow as a second applied load.
Procedure for an unfamiliar variant
- Identify axial load, any moments, actual length and restraints in each axis.
- Choose/read a section and confirm strength from the actual thickness.
- Check the appropriate flange and web local-slenderness limits.
- Find and separately; select each axis curve and interpolate .
- Calculate both axial resistances and identify the governing axis.
- If moments exist, complete section, flexural and axial/LTB interactions using their own capacities and moment definitions.
Independent self-check
Try it yourself. Invented variant: the same column now carries design axial compression, with the same length and restraints. Does it pass?
Reveal answer and reasoning
No. Non-slender classification and buckling resistance are unchanged. Utilisation. The gross squash resistance cannot override the member buckling failure.
Animation labEffective length and buckling axes
Supplement to the original lesson. Enable JavaScript to play, step through calculations and rotate 3D models. The following explanation remains readable offline.
- A column can bow sideways before its section reaches the crushing resistance.
- Each axis has its own radius of gyration and restraint spacing.
- , with compatible length units. A tie affects only the directions it actually restrains.
- Select each buckling curve and compressive strength before forming Pc. The governing axis is determined by resistance, not slenderness alone.
Column example 2: a weak-axis tie permits a lighter section
Open this example on its own page
Repeat the axial-column design with a pinned column and an effective midheight tie against weak-axis buckling. Select and check a Grade S355 UC.
Original source: LectureNotes/Ch 4_Column.pdf — p. 23, p. 24. Values tagged given are in the question or diagram; lookup values come from a named table; calculated values follow from the working; assumptions are stated explicitly.
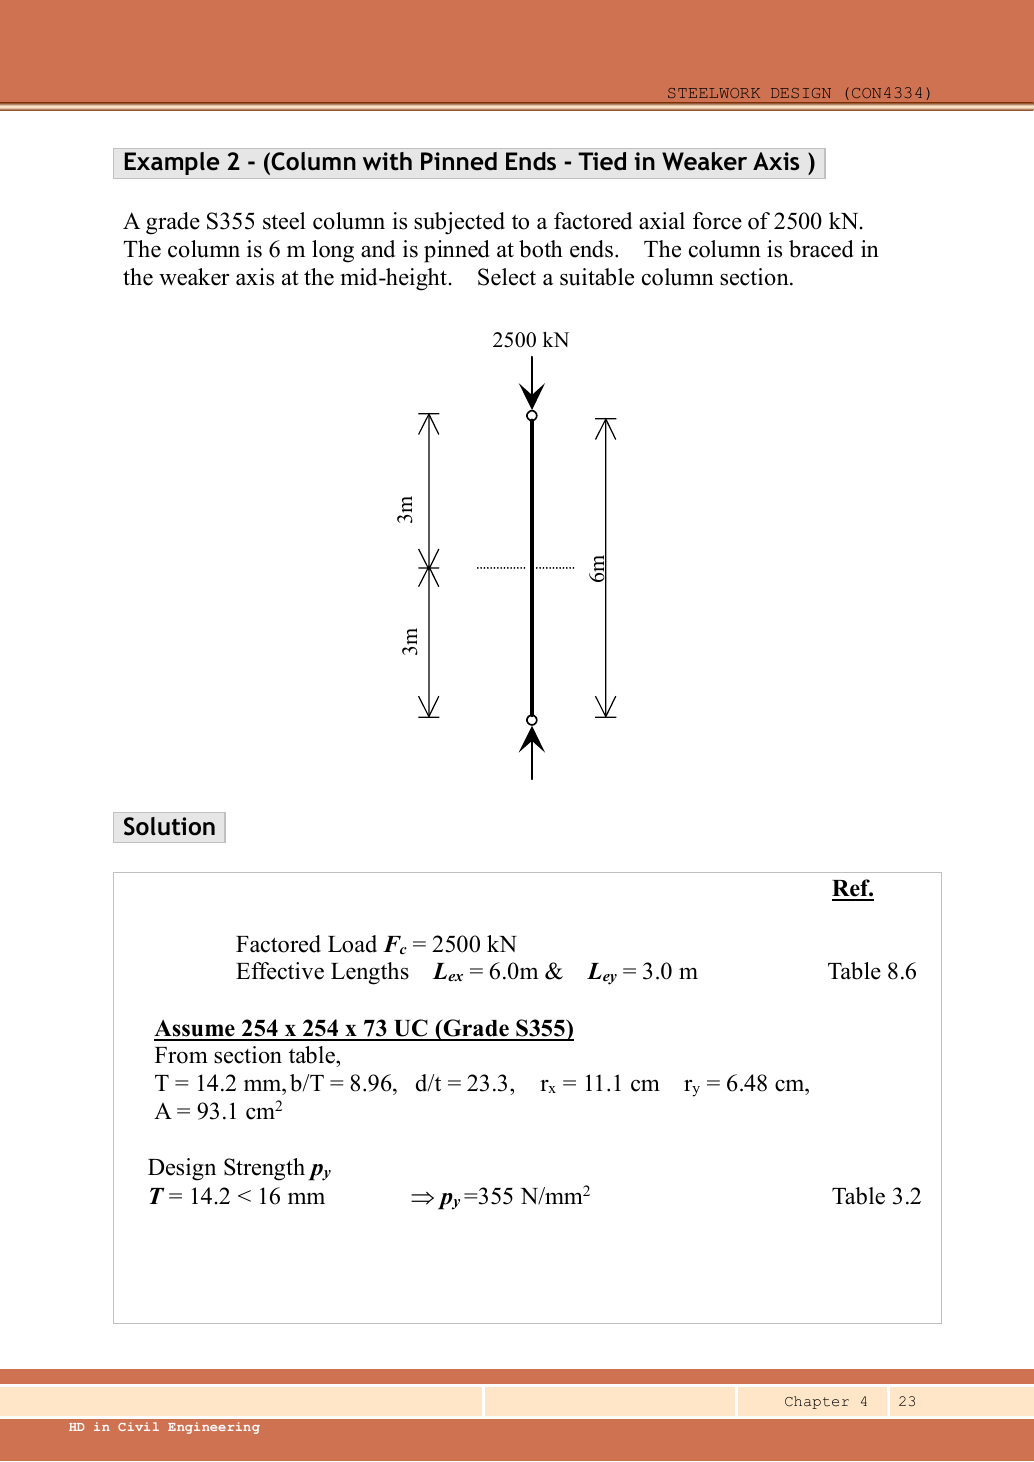
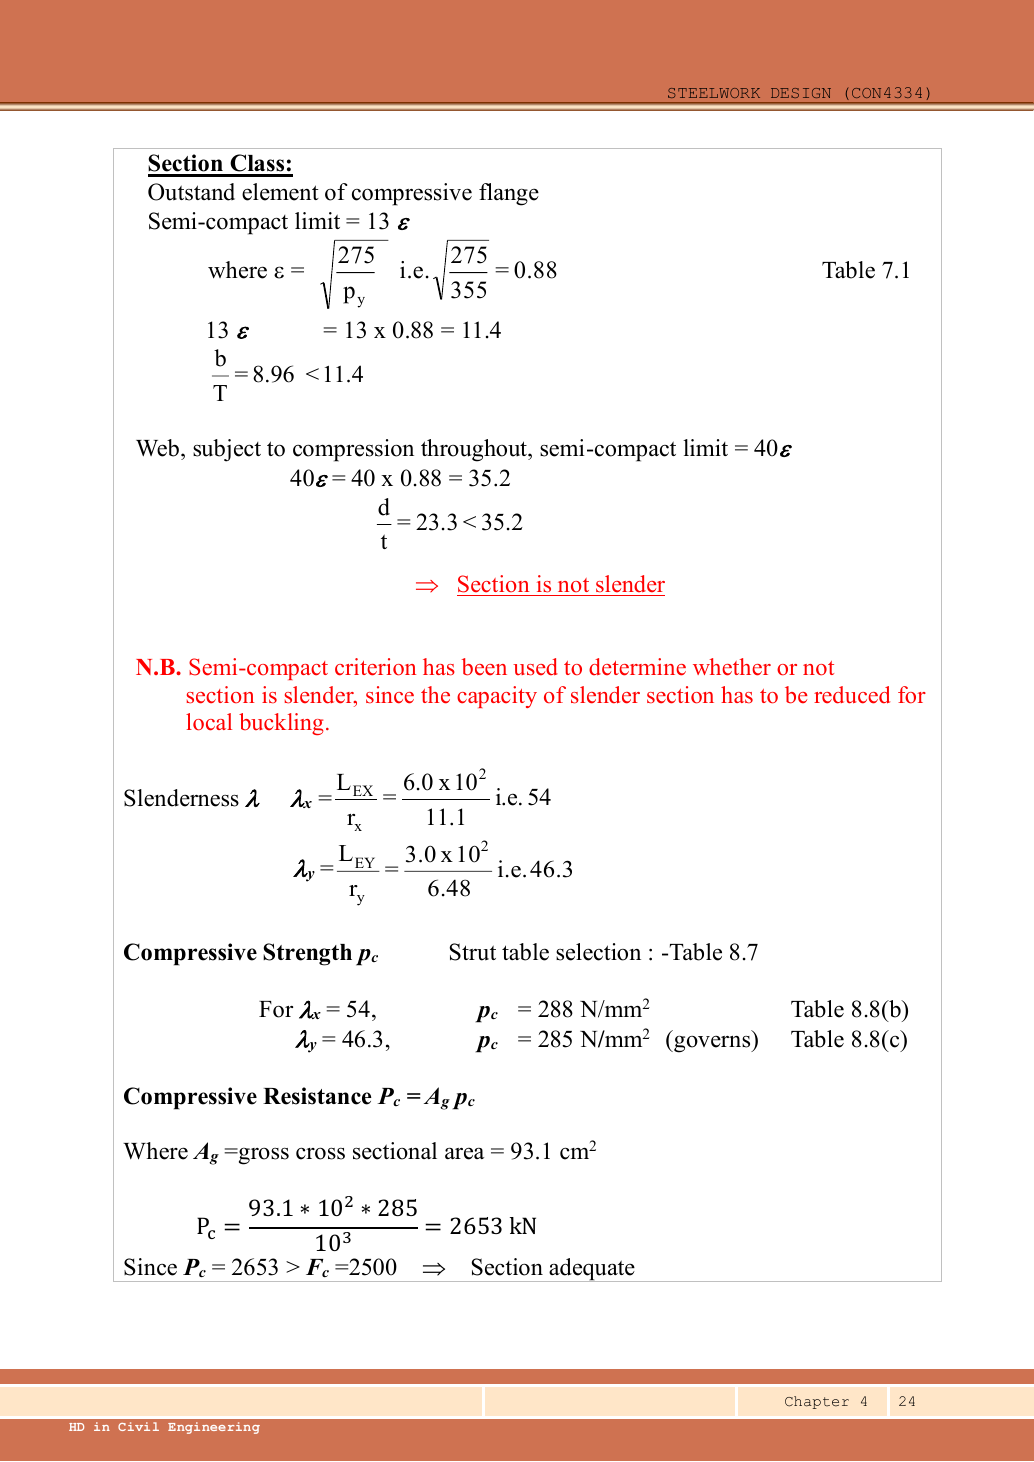
Read the diagram and collect the data
| Input | Origin |
|---|---|
| Axial force | Given design compression. |
| Direction of tie | Question states weak direction: shorten -axis buckling length only. |
| Trial section | Data File p.11, UC: , , , , , . |
| Tables | pᵧ355 because ; rolled H uses curves b/c. |
Before calculating: recognition and strategy
Compare this to Example 1: restraints can be as important as area. The weak-axis tie reduces its unbraced length from to . A smaller column is now possible, but after changing section both radii, the area and the thickness-dependent strength must be reread. Do not reuse Example 1’s section properties.
1. Set each effective length
Simple explanation: Why a long column can fail before crushing
Push a long thin ruler from both ends: it may bow sideways first.
- Find effective length and radius of gyration for each axis.
- Calculate slenderness for both directions.
- Use the appropriate buckling curve before forming resistance.
Remember: Compare the final resistances; slenderness alone may not identify the controlling axis.
A horizontal positional restraint suppresses a buckling displacement. It does not support half the vertical load or create a new compression case.
Animation labEffective length and buckling axes
Supplement to the original lesson. Enable JavaScript to play, step through calculations and rotate 3D models. The following explanation remains readable offline.
- A column can bow sideways before its section reaches the crushing resistance.
- Each axis has its own radius of gyration and restraint spacing.
- , with compatible length units. A tie affects only the directions it actually restrains.
- Select each buckling curve and compressive strength before forming Pc. The governing axis is determined by resistance, not slenderness alone.
2. Trial UC
These values come from the same exact section row on Data File p.11. This lighter trial is the one selected in the lecture.
Animation labEffective length and buckling axes
Supplement to the original lesson. Enable JavaScript to play, step through calculations and rotate 3D models. The following explanation remains readable offline.
- A column can bow sideways before its section reaches the crushing resistance.
- Each axis has its own radius of gyration and restraint spacing.
- , with compatible length units. A tie affects only the directions it actually restrains.
- Select each buckling curve and compressive strength before forming Pc. The governing axis is determined by resistance, not slenderness alone.
3. Check local slenderness
Animation labWhy thin elements buckle locally
Supplement to the original lesson. Enable JavaScript to play, step through calculations and rotate 3D models. The following explanation remains readable offline.
- The flange outstand and web have different widths, thicknesses and edge support conditions.
- A thinner plate can wrinkle locally before the complete member loses stability.
- Class 1 allows plastic rotation; Class 2 reaches plastic resistance; Class 3 reaches elastic resistance; Class 4 requires effective properties.
- Check every relevant compression element with the supplied limits and stress distribution. The deformation shown is qualitative.
4. Slenderness for the tied and untied directions
Now exceeds . That alone does not prove the axis controls because its curve b is more favourable than the weak-axis curve c.
Animation labEffective length and buckling axes
Supplement to the original lesson. Enable JavaScript to play, step through calculations and rotate 3D models. The following explanation remains readable offline.
- A column can bow sideways before its section reaches the crushing resistance.
- Each axis has its own radius of gyration and restraint spacing.
- , with compatible length units. A tie affects only the directions it actually restrains.
- Select each buckling curve and compressive strength before forming Pc. The governing axis is determined by resistance, not slenderness alone.
5. Interpolate each curve
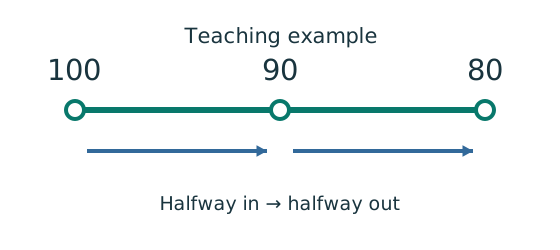
Simple explanation: A value between two table rows
Move the same fraction of the way across both number ranges.
- Choose the correct table, curve and strength column first.
- Find how far your input lies between the two rows.
- Apply that fraction to the change between their answers.
Remember: Teaching example: halfway between outputs 100 and 80 gives 90.
Use Table 8.8(b), pᵧ355 for and Table 8.8(c), pᵧ355 for .
Despite its smaller slenderness, the weak axis gives the slightly smaller strength. The source values and are rounded representations.
Animation labEffective length and buckling axes
Supplement to the original lesson. Enable JavaScript to play, step through calculations and rotate 3D models. The following explanation remains readable offline.
- A column can bow sideways before its section reaches the crushing resistance.
- Each axis has its own radius of gyration and restraint spacing.
- , with compatible length units. A tie affects only the directions it actually restrains.
- Select each buckling curve and compressive strength before forming Pc. The governing axis is determined by resistance, not slenderness alone.
6. Check the controlling resistance
The original rounds to , giving , printed . The exact interpolation gives . The tie makes the trial adequate where the untied example used . This conclusion assumes the tie provides the stated effective restraint; tie design itself is not part of this question.
Animation labEffective length and buckling axes
Supplement to the original lesson. Enable JavaScript to play, step through calculations and rotate 3D models. The following explanation remains readable offline.
- A column can bow sideways before its section reaches the crushing resistance.
- Each axis has its own radius of gyration and restraint spacing.
- , with compatible length units. A tie affects only the directions it actually restrains.
- Select each buckling curve and compressive strength before forming Pc. The governing axis is determined by resistance, not slenderness alone.
Compact exam answer
Use S355 UC,; under the , limits, it is non-slender., ; , . Curves b/c give , . , adequate. Rounded source resistance .
Mistakes to avoid
- The tie changes only its effective buckling direction.
- Use the full axial force in both portions.
- Compare actual values, not slenderness alone.
- Reclassify after selecting a lighter section.
Procedure for an unfamiliar variant
- Identify axial load, any moments, actual length and restraints in each axis.
- Choose/read a section and confirm strength from the actual thickness.
- Check the appropriate flange and web local-slenderness limits.
- Find and separately; select each axis curve and interpolate .
- Calculate both axial resistances and identify the governing axis.
- If moments exist, complete section, flexural and axial/LTB interactions using their own capacities and moment definitions.
Independent self-check
Try it yourself. Invented variant: remove the weak-axis tie but retain UC. Find the weak-axis slenderness and estimate its supplied-table resistance.
Reveal answer and reasoning
. Curve c,pᵧ355: row gives and gives , so . , much less than . The untied version fails.
Animation labEffective length and buckling axes
Supplement to the original lesson. Enable JavaScript to play, step through calculations and rotate 3D models. The following explanation remains readable offline.
- A column can bow sideways before its section reaches the crushing resistance.
- Each axis has its own radius of gyration and restraint spacing.
- , with compatible length units. A tie affects only the directions it actually restrains.
- Select each buckling curve and compressive strength before forming Pc. The governing axis is determined by resistance, not slenderness alone.
Animation labEffective length and buckling axes
Supplement to the original lesson. Enable JavaScript to play, step through calculations and rotate 3D models. The following explanation remains readable offline.
- A column can bow sideways before its section reaches the crushing resistance.
- Each axis has its own radius of gyration and restraint spacing.
- , with compatible length units. A tie affects only the directions it actually restrains.
- Select each buckling curve and compressive strength before forming Pc. The governing axis is determined by resistance, not slenderness alone.
3. Cross-section capacity: compression and bending share the same steel Always examined
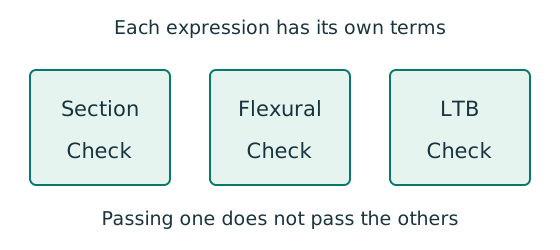
Simple explanation: The column needs more than one pass
A slice can be strong while the whole member still buckles.
- Check cross-section compression plus bending.
- Then check the separate member-buckling expressions.
- Keep each moment, factor and resistance in its specified expression.
Remember: The three checks do not share interchangeable denominators.
is the design compression; and are the design moments at the same place (amplified as the question says); is the section area. Each term is demand ÷ capacity with no units, so keep force with force and moment with moment. Add the moments as positive values — moments about the two axes never cancel each other.
For a UC the weak axis is almost always limited by ; using alone overestimates it. The first denominator is (the force that crushes the section), not the buckling resistance .
Animation labA strong slice can belong to an unstable member
Supplement to the original lesson. Enable JavaScript to play, step through calculations and rotate 3D models. The following explanation remains readable offline.
- Combine axial compression and the two bending demands using the specified section resistances.
- The whole member adds effective-length and buckling-curve effects.
- This uses its own moment factor and bending resistance; it is not a copy of the section check.
- Elastic, plastic and buckling resistances are not interchangeable. Read the three original expressions and their first-order/amplified moments.
4. Member buckling: the two interaction formulas Always examined
Simple explanation: The column needs more than one pass
A slice can be strong while the whole member still buckles.
- Check cross-section compression plus bending.
- Then check the separate member-buckling expressions.
- Keep each moment, factor and resistance in its specified expression.
Remember: The three checks do not share interchangeable denominators.
The lecture’s original formulas use an overbar () for the unamplified first-order moment, and the small bar is easy to miss. Here it is written (unamplified), with and for the amplified ones. Both member formulas always use the elastic in the moment denominators, even for a Class 1 section.
Non-sway flexural-buckling interaction (course Eq.8.80): Combined axial force/LTB (Eq.8.81):
In formula 1, is the smaller of the two axis buckling resistances; formula 2 uses (minor axis). is the major-axis moment that drives LTB; exams usually give it directly, already amplified — do not amplify it again. The last term of formula 2 uses the unamplified , while formula 1 uses the amplified ; that is why lecture example 5 shows both 30 and 34.5 kN·m.
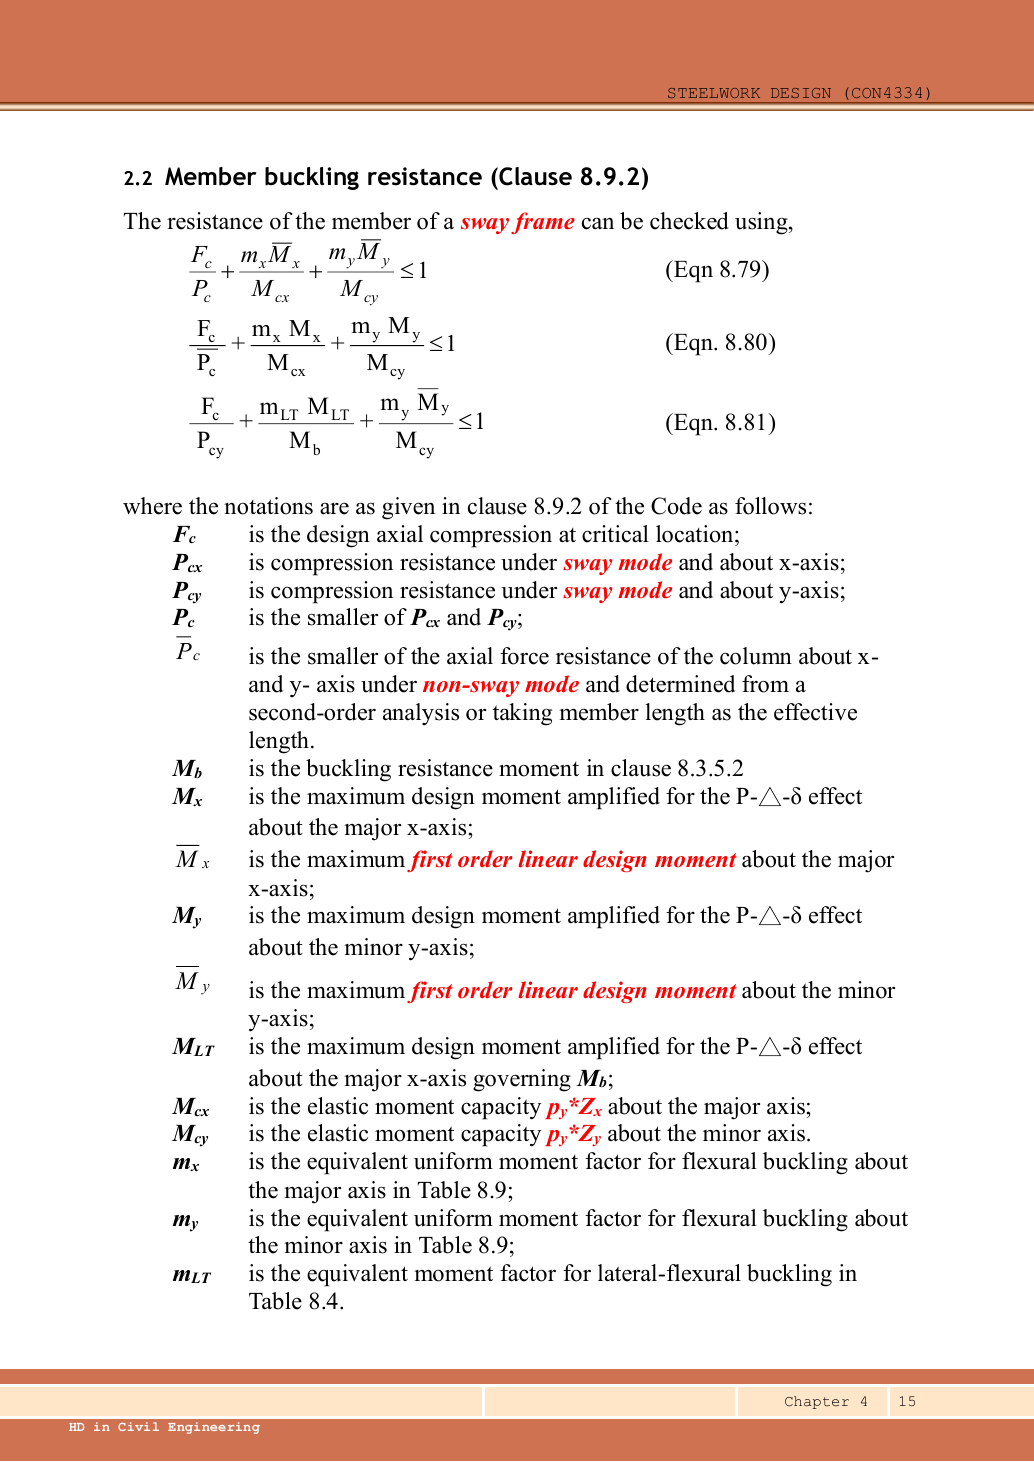
Eqn 8.79: Eqn 8.80: Eqn 8.81: Source definitions: is the design compressive force at the critical location; , are the compression resistances about the two axes in sway mode; is the smaller of these; is the smaller of the two non-sway compression resistances, obtained by second-order analysis or by taking effective length equal to actual member length. is the buckling moment resistance under clause 8.3.5.2. , are the maximum major- and minor-axis design moments already amplified for effects; , are the corresponding first-order linear-analysis moments. is the amplified major-axis moment governing . In this source figure, , denotes elastic moment resistance. , comes from Table 8.9; comes from Table 8.4.Open full-size image
(Recognition only.) Sway frames use Eq.8.79; non-sway frames use Eq.8.80; Eq.8.81 adds LTB. Lecture p.17 says numerical design of sway columns is outside this course, so exams and worked answers use only the non-sway formulas.
Animation labA strong slice can belong to an unstable member
Supplement to the original lesson. Enable JavaScript to play, step through calculations and rotate 3D models. The following explanation remains readable offline.
- Combine axial compression and the two bending demands using the specified section resistances.
- The whole member adds effective-length and buckling-curve effects.
- This uses its own moment factor and bending resistance; it is not a copy of the section check.
- Elastic, plastic and buckling resistances are not interchangeable. Read the three original expressions and their first-order/amplified moments.
5. Non-sway, sway and ultra-sensitive frames Background
| Source analysis route | Non-sway | Sway | Ultra-sensitive |
|---|---|---|---|
| Ordinary course route | |||
| Advanced-analysis classification quoted by lecture |
is the elastic critical load factor: how many times the loads must be multiplied before the frame becomes unstable. It is not the member slenderness . is non-sway: the global P–Δ effect may be simplified, but the member’s own P–δ may still need amplifying. is ultra-sensitive and needs second-order or advanced analysis.
Animation labRestraints, sway and imperfections
Supplement to the original lesson. Enable JavaScript to play, step through calculations and rotate 3D models. The following explanation remains readable offline.
- A frame needs a defined path for horizontal force as well as gravity.
- Pinned joints alone do not provide frame moment resistance; sway restraint needs a real structural system.
- Diagonal bracing carries horizontal action through axial forces. This sketch does not assign a numerical frame classification.
- Use the specified imperfection/notional-force model and critical-load criteria. Avoid counting alternative imperfection models twice.
6. Why compression makes moments bigger (amplification) Often examined
Simple explanation: Moving sideways gives the load a new lever arm
Once a compressed member moves sideways, the same compression creates extra moment.
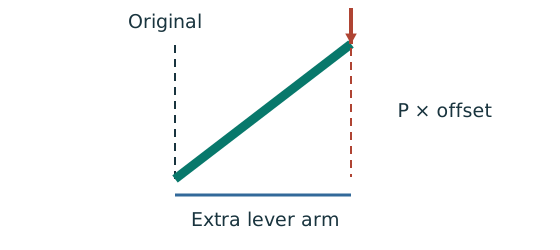
- P–Δ concerns overall frame or storey movement.
- P–δ concerns bowing relative to the member’s end line.
- Amplify only the first-order moments specified by the method.
Remember: Do not amplify a moment that the question already gives as amplified.
A compressive force acting through a sideways displacement creates an extra moment. Capital usually means the sway of a whole storey; small means the bow of the member itself. Second-order analysis includes these directly; exam questions usually just give the amplification factor — multiply the first-order moment by it once.
Global amplification factor: Member amplification factor:
is the design vertical load at and above the storey; the notional horizontal force; the storey height; the storey drift caused by . Non-sway member design uses the member factor. Keep units consistent so the ratios have no units. A denominator ≤ 0 means instability has been reached, not a negative amplification.
Try it yourself. Invented arithmetic: , Fᴺ/Fᵥ=0.005, δᴺ=2 mm. Find and the global factor.
Reveal answer and reasoning
. The ordinary route is at the non-sway boundary. The displayed global factor is ; a separate member effect may still govern.
Animation labSeparate P–Δ from P–δ
Supplement to the original lesson. Enable JavaScript to play, step through calculations and rotate 3D models. The following explanation remains readable offline.
- The dashed line marks the original frame position; axial compression acts downwards.
- Global displacement Δ creates the additional moment PΔ.
- Local displacement δ is measured from the line joining the displaced ends, and adds Pδ.
- Follow the original analysis route. Do not amplify an already amplified moment or confuse critical-load factor with member slenderness.
Concept map: P–Δ and P–δ: why deformation makes the moment bigger
Concept map
P–Δ and P–δ: why deformation makes the moment bigger
One of the most frequent theory questions (3 times in 16 papers). Read from top to bottom: compression plus an offset → the two effects → the snowball → how analysis and design deal with it → the exam answer.
- Cause
- Key idea
- Result
- What changes it
- How design deals with it
- Exam answer
- marks are often lost here
Text version (from cause to result)
Cause
Axial compression
A column carries a large compression . As soon as it does not push straight down the centre line, it adds a moment.
Comes from (upstream)— (a starting point)
Leads to (downstream) P–Δ effect (global) P–δ effect (member)
Cause
The frame sways
Horizontal loads such as wind, or a frame that is not perfectly plumb (design assumes a lean of ), move the top of a storey sideways by relative to its base.
Source: Lecture: global imperfection , or a notional horizontal force of 0.5% of the vertical load.
Comes from (upstream)— (a starting point)
Leads to (downstream) P–Δ effect (global)
Cause
The member bows
No member is perfectly straight (initial bow about to , depending on the buckling curve), and it bows out by between its ends under moment.
Comes from (upstream)— (a starting point)
Leads to (downstream) P–δ effect (member)
Key idea
P–Δ effect (global)
The compression acts through the storey sway and creates an extra moment . It is an effect of the whole frame.
Comes from (upstream) Axial compression The frame sways
Leads to (downstream)A snowball: more bending, more moment How far from instabilityExam answer: definition + both effects + sketch
Key ideaWhere marks are lost
P–δ effect (member)
The compression acts through the member’s own bow and creates an extra moment . It is an effect of one member.
Comes from (upstream) Axial compression The member bows
Leads to (downstream)A snowball: more bending, more momentExam answer: definition + both effects + sketch
Result
A snowball: more bending, more moment
The extra moment bends the member more, the offset grows, and so does the extra moment. Deflections increase, stiffness drops, and in the worst case the frame becomes unstable.
Comes from (upstream) P–Δ effect (global) P–δ effect (member)
Leads to (downstream)Second-order analysis: equilibrium on the deformed shape Amplification factor: add it in one go
How design deals with it
Second-order analysis: equilibrium on the deformed shape
First-order analysis writes equilibrium on the original, undeformed shape and misses the extra moments; second-order analysis writes it on the deformed shape and includes them. A P–Δ–δ analysis also includes member bow and imperfections.
Comes from (upstream)A snowball: more bending, more moment
Leads to (downstream)Four load–displacement curvesExam answer: definition + both effects + sketch
What changes itWhere marks are lost
How far from instability
The elastic critical load factor: how many times the loads must be multiplied before the frame becomes unstable. is non-sway and P–Δ may be simplified; is ultra-sensitive and needs second-order or advanced analysis.
Source: Columns lecture section 5
Comes from (upstream) P–Δ effect (global)
Leads to (downstream) Amplification factor: add it in one go
Exam answer
Four load–displacement curves
First-order elastic: a straight line; second-order elastic: stiffness gradually drops; first-order plastic: reaches a plateau (mechanism); second-order elastic-plastic: a lower peak, then the load falls.
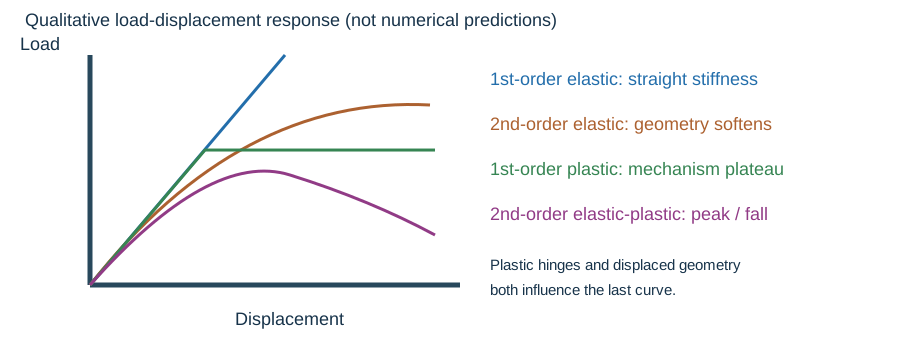
Source: Short theory: four analysis types (asked once)
Comes from (upstream)Second-order analysis: equilibrium on the deformed shape
Leads to (downstream)— (the last step)
How design deals with itWhere marks are lost
Amplification factor: add it in one go
Without a second-order analysis, multiply the first-order moment by an amplification factor to include the extra moment. Exam questions usually give the factor (e.g. 1.1).
Source: How it is used: columns crash course.
Comes from (upstream)A snowball: more bending, more moment How far from instability
Leads to (downstream)— (the last step)
Exam answer
Exam answer: definition + both effects + sketch
Write one definition (equilibrium on the deformed shape), one line each for P–Δ and P–δ, and a sketch: a frame swaying by on the left and a column bowing by on the right.
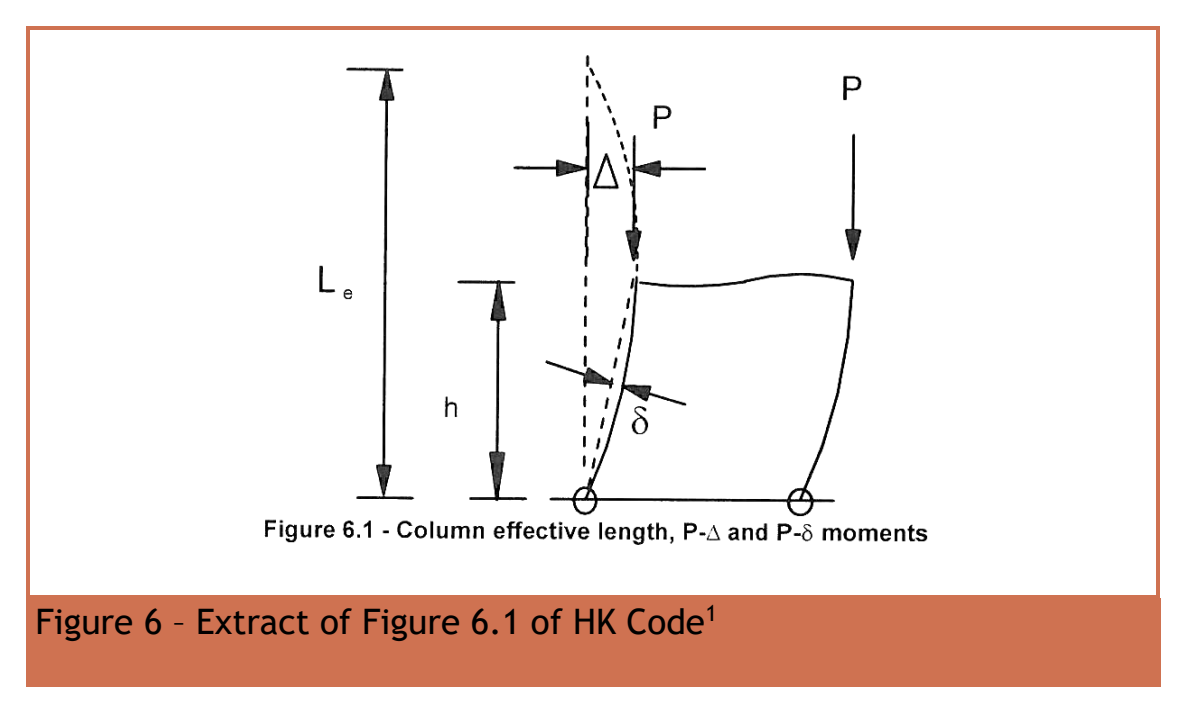
Comes from (upstream) P–Δ effect (global) P–δ effect (member)Second-order analysis: equilibrium on the deformed shape
Leads to (downstream)— (the last step)
Tour steps
1. The cause: compression plus an offset
Compression alone adds no moment; it must act through an offset. There are two kinds of offset: storey sway or member bow .
In this step Axial compression The frame sways The member bows
2. The two effects
Compression × storey sway = P–Δ (global); compression × member bow = P–δ (member).
In this step P–Δ effect (global) P–δ effect (member)
3. The snowball
Extra moment → more deformation → more extra moment. That is why it cannot be ignored.
In this stepA snowball: more bending, more moment
4. Analysis
First-order analysis cannot see it; second-order analysis works on the deformed shape. The four analysis curves may also be asked on their own.
In this stepSecond-order analysis: equilibrium on the deformed shapeFour load–displacement curves
5. How design deals with it
Use to judge how sensitive the frame is; in calculations multiply the first-order moment by the amplification factor, once only.
In this step How far from instability Amplification factor: add it in one go
6. The exam answer
Definition + P–Δ + P–δ + sketch, about 4 marks. No essay needed.
In this stepExam answer: definition + both effects + sketch
Animation labSeparate P–Δ from P–δ
Supplement to the original lesson. Enable JavaScript to play, step through calculations and rotate 3D models. The following explanation remains readable offline.
- The dashed line marks the original frame position; axial compression acts downwards.
- Global displacement Δ creates the additional moment PΔ.
- Local displacement δ is measured from the line joining the displaced ends, and adds Pδ.
- Follow the original analysis route. Do not amplify an already amplified moment or confuse critical-load factor with member slenderness.
7. Column moment factors (not the same as ) Always examined
Simple explanation: Similar-looking moment factors come from different tables
Two recipes can use the same ingredients but different amounts.
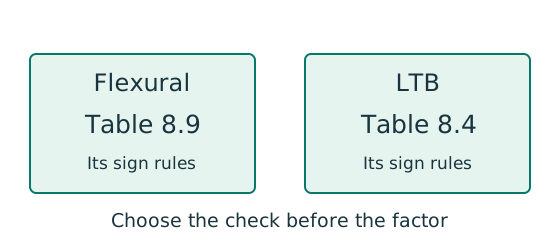
- Identify flexural buckling or lateral-torsional buckling first.
- Read the actual moment diagram, including any change of sign.
- Use that check’s table and its own sign and minimum-factor rules.
Remember: Table 8.9 flexural factors are not Table 8.4 LTB factors.
For a column length with end moments only, use in Table 8.9. Exams usually give the applied top and bottom moments with clockwise positive: same sign at both ends → double curvature → negative; opposite signs → single curvature → positive. That is (when the top moment is larger). A quick sketch helps you confirm.
When : .
When : .
For example, ; .
But Table 8.4a for LTB, at , gives .
Table 8.9 (columns) and Table 8.4 (LTB) differ most for double curvature, and their quarter-point formulas also differ. The general Table 8.9 formula is:
and are the quarter-point moments, the mid-point moment, and the largest moment in the middle half. If all three are on the same side, take them positive; if they cross zero, take as positive the side that gives the larger . The lecture’s special cases: one central point load 0.90, UDL 0.95, three equal point loads 0.95, two equal point loads 0.80.
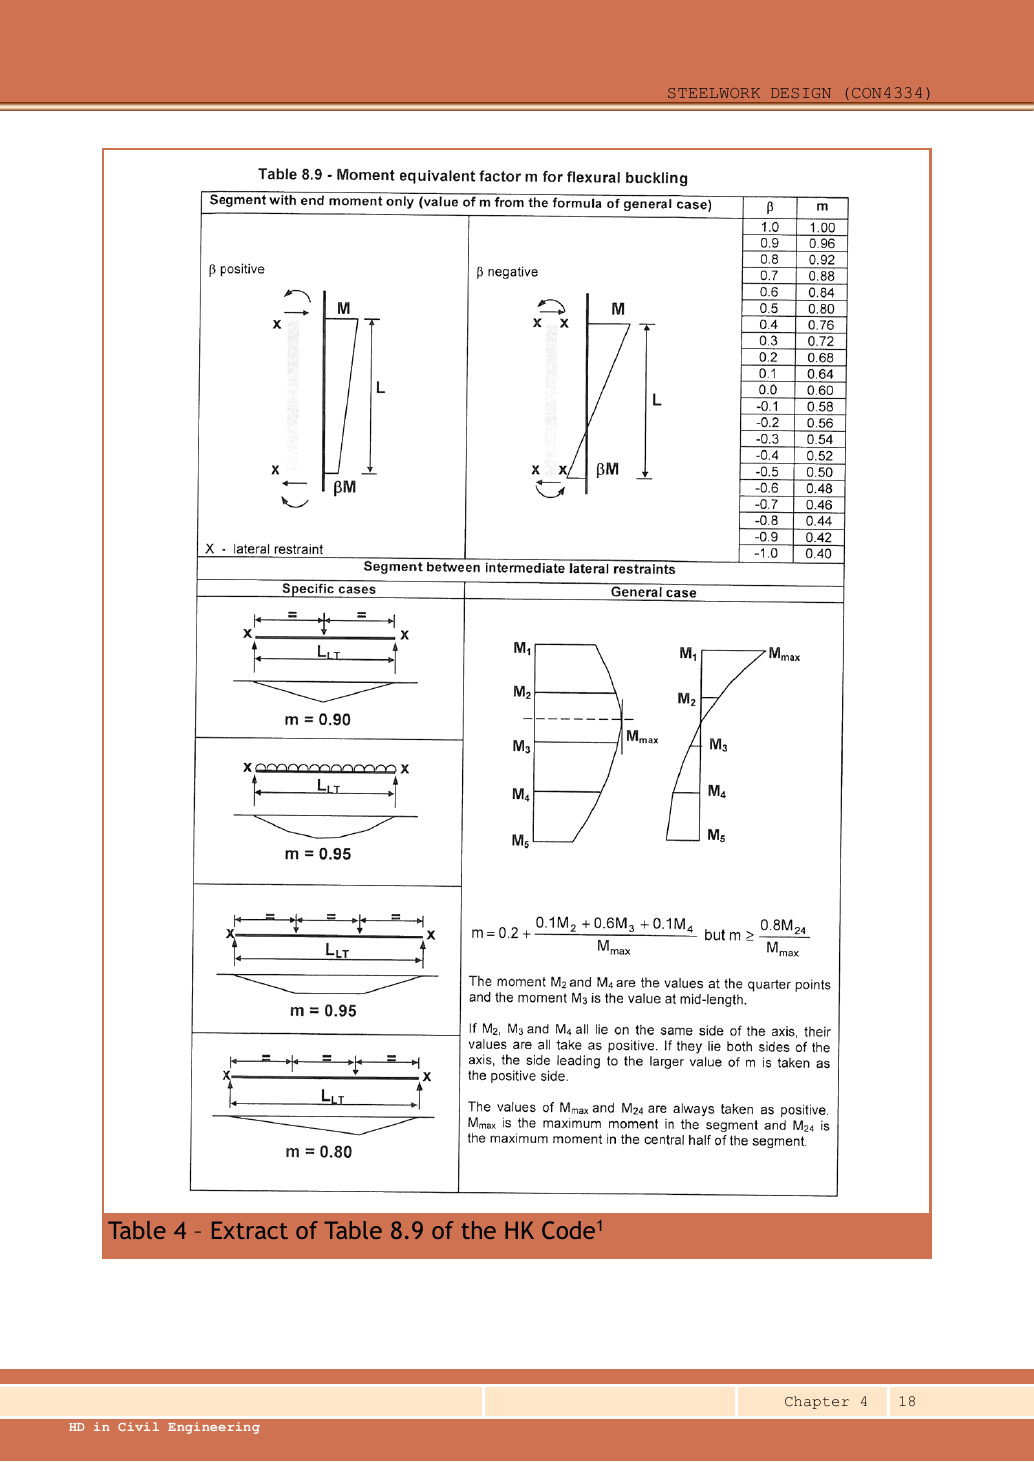
,,,,,,,,,,,,,,,,,,,,.
The special cases at lower left, from top to bottom, are: one point load at midspan, ; UDL, ; three equal, equally spaced point loads, ; two equal point loads at the third points, . In the lower-right sketch, , are the ends; , are the quarter points; is the midpoint. The source expression is:but . If all three sampled moments lie on the same side, take them positive. If they lie on different sides, choose as positive the side producing the larger . , are both positive: respectively the maximum moment over the whole segment and over its central half.Open full-size image
Concept map: C shape or S shape? The sign of and the moment factors and
Concept map
C shape or S shape? The sign of and the moment factors and
Every year marks are lost on the sign of in the column question. Picture the shape the end moments bend the column into and the sign follows; then keep and apart — which table and which term.
- Cause
- Key idea
- Result
- What changes it
- How design deals with it
- Exam answer
- marks are often lost here
Text version (from cause to result)
Cause
, End moments at top and bottom
Exam papers usually give the applied top and bottom moments for each axis, clockwise positive.
Comes from (upstream)— (a starting point)
Leads to (downstream)Does the column bend into a C or an S? End-moment ratio and its sign
Key idea
Does the column bend into a C or an S?
Single curvature: the whole column bends to one side, like a C. Double curvature: there is a point of contraflexure in between, like an S.
Comes from (upstream), End moments at top and bottom
Leads to (downstream)An S shape is much less dangerous End-moment ratio and its sign
Result
An S shape is much less dangerous
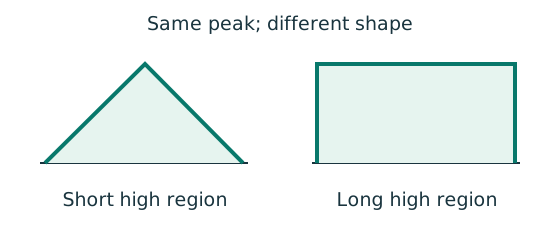
A C shape matches the shape the column buckles into, so it is the most dangerous; in an S shape the two halves bend opposite ways, so buckling is harder to trigger and the equivalent moment () is smaller.
Comes from (upstream)Does the column bend into a C or an S?
Leads to (downstream), Column buckling: Table 8.9 Lateral-torsional buckling: Table 8.4a
Key ideaWhere marks are lost
End-moment ratio and its sign
= smaller end moment ÷ larger end moment: positive for single curvature (C), negative for double curvature (S). With clockwise positive: same sign at both ends → double → negative; opposite signs → single → positive.
Comes from (upstream), End moments at top and bottomDoes the column bend into a C or an S?
Leads to (downstream), Column buckling: Table 8.9 Lateral-torsional buckling: Table 8.4a
How design deals with it
, Column buckling: Table 8.9
(); (). Each axis uses its own .
Comes from (upstream) End-moment ratio and its signAn S shape is much less dangerous
Leads to (downstream)The two tables are not interchangeableWhich term each one multiplies
How design deals with it
Lateral-torsional buckling: Table 8.4a
, using the major-axis .
Comes from (upstream) End-moment ratio and its signAn S shape is much less dangerous
Leads to (downstream)The two tables are not interchangeableWhich term each one multiplies
What changes it
The two tables are not interchangeable
Table 8.9 (column buckling) and Table 8.4 (LTB) differ most in double curvature, and their quarter-point formulas differ too. Decide which check it is first, then pick the table.
Comes from (upstream), Column buckling: Table 8.9 Lateral-torsional buckling: Table 8.4a
Leads to (downstream)Exam: give the reason for the sign
How design deals with itWhere marks are lost
Which term each one multiplies
Formula 1: and . Formula 2: and . The cross-section formula uses no .
Comes from (upstream), Column buckling: Table 8.9 Lateral-torsional buckling: Table 8.4a
Leads to (downstream)Simple construction: all equal 1Exam: give the reason for the sign
What changes it
Simple construction: all equal 1
For a column bent by eccentric beam reactions (simple construction), . See the simple-construction map.
Comes from (upstream)Which term each one multiplies
Leads to (downstream)— (the last step)
Exam answer
Exam: give the reason for the sign
For each axis: end moments → same or opposite sign → single or double → → . 2024: axis +75 / +45 → → ; axis +65 / −39 → → ; .
Comes from (upstream)Which term each one multipliesThe two tables are not interchangeable
Leads to (downstream)— (the last step)
Tour steps
1. The end moments decide the shape
First picture whether the column bends into a C or an S.
In this step, End moments at top and bottomDoes the column bend into a C or an S?
2. Why is an S safer?
A C matches the buckled shape; an S has halves bending opposite ways, so is smaller.
In this stepAn S shape is much less dangerous
3. The sign of
C is positive, S is negative. With clockwise positive, same sign = S = negative.
In this step End-moment ratio and its sign
4. Two tables
Column buckling uses Table 8.9 for ; LTB uses Table 8.4a for — not interchangeable.
In this step, Column buckling: Table 8.9 Lateral-torsional buckling: Table 8.4aThe two tables are not interchangeable
5. Where they go
appears only in the two buckling formulas; in simple construction they are all 1.
In this stepWhich term each one multipliesSimple construction: all equal 1
6. In the exam
For each axis write the reason: “same / opposite sign → single / double → ”.
In this stepExam: give the reason for the sign
Column example 5: axial load plus biaxial end moments
Open this example on its own page
Check a UC S355 column in a braced non-sway frame, long, fixed at one end and pinned at the other. Design compression is . First-order factored end moments are (top/bottom)=/ and Mᵧ(top/bottom)=/. Amplification factors are about and about . The given amplified Mᴸᵀ=86.4 kNm has the same distribution as .
Original source: LectureNotes/Ch 4_Column.pdf — p. 36, p. 37, p. 38. Values tagged given are in the question or diagram; lookup values come from a named table; calculated values follow from the working; assumptions are stated explicitly.
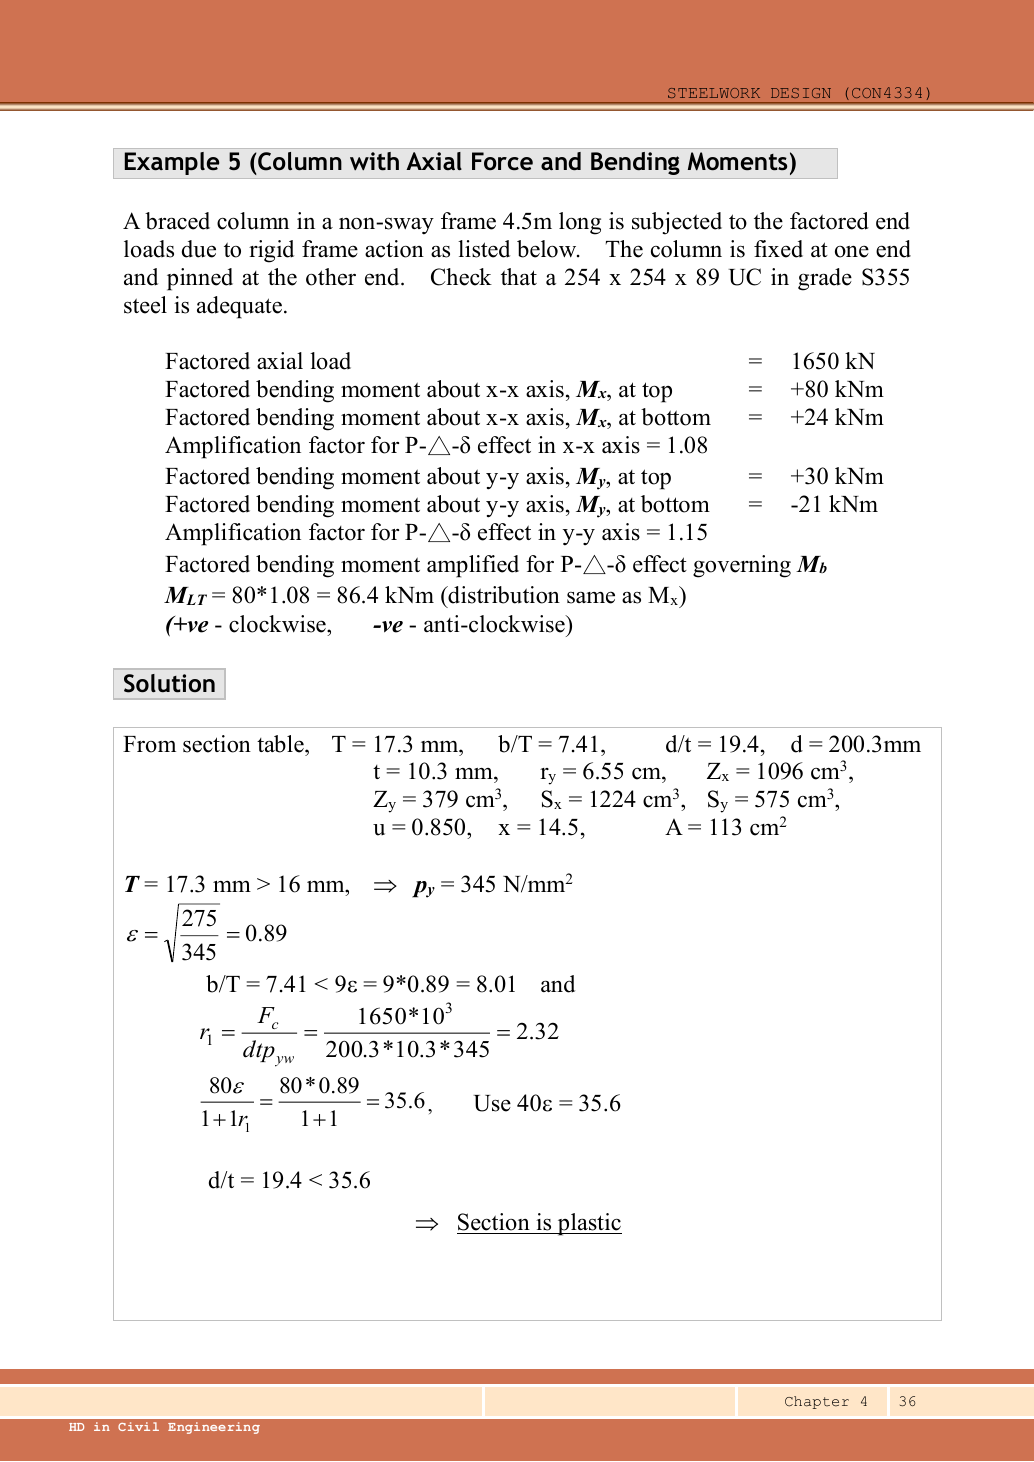
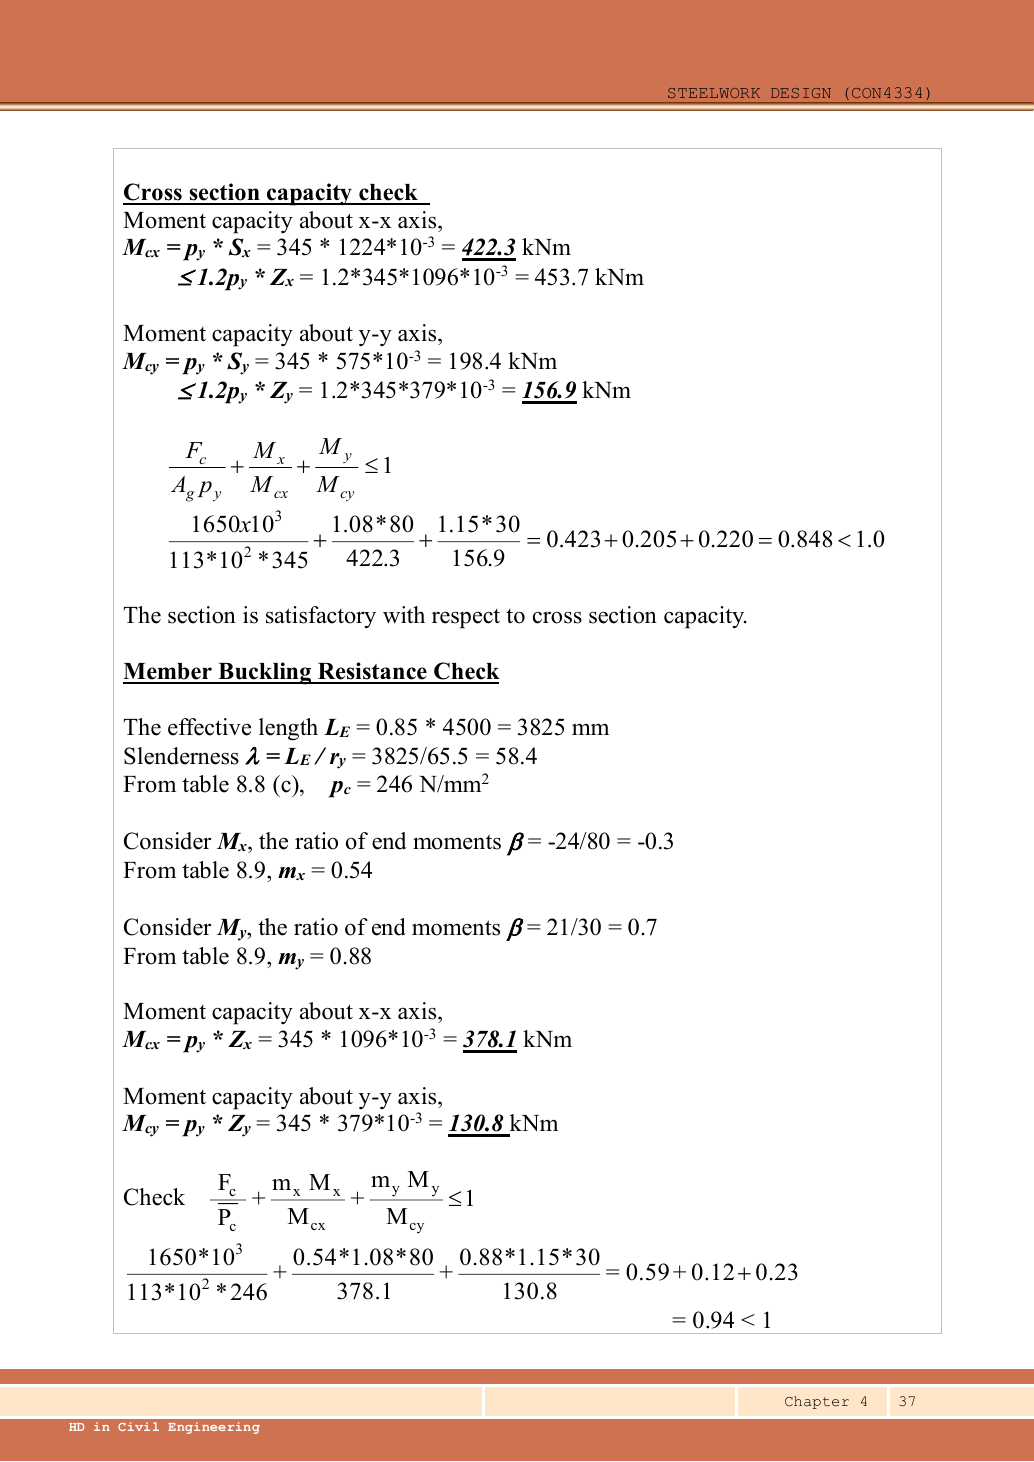
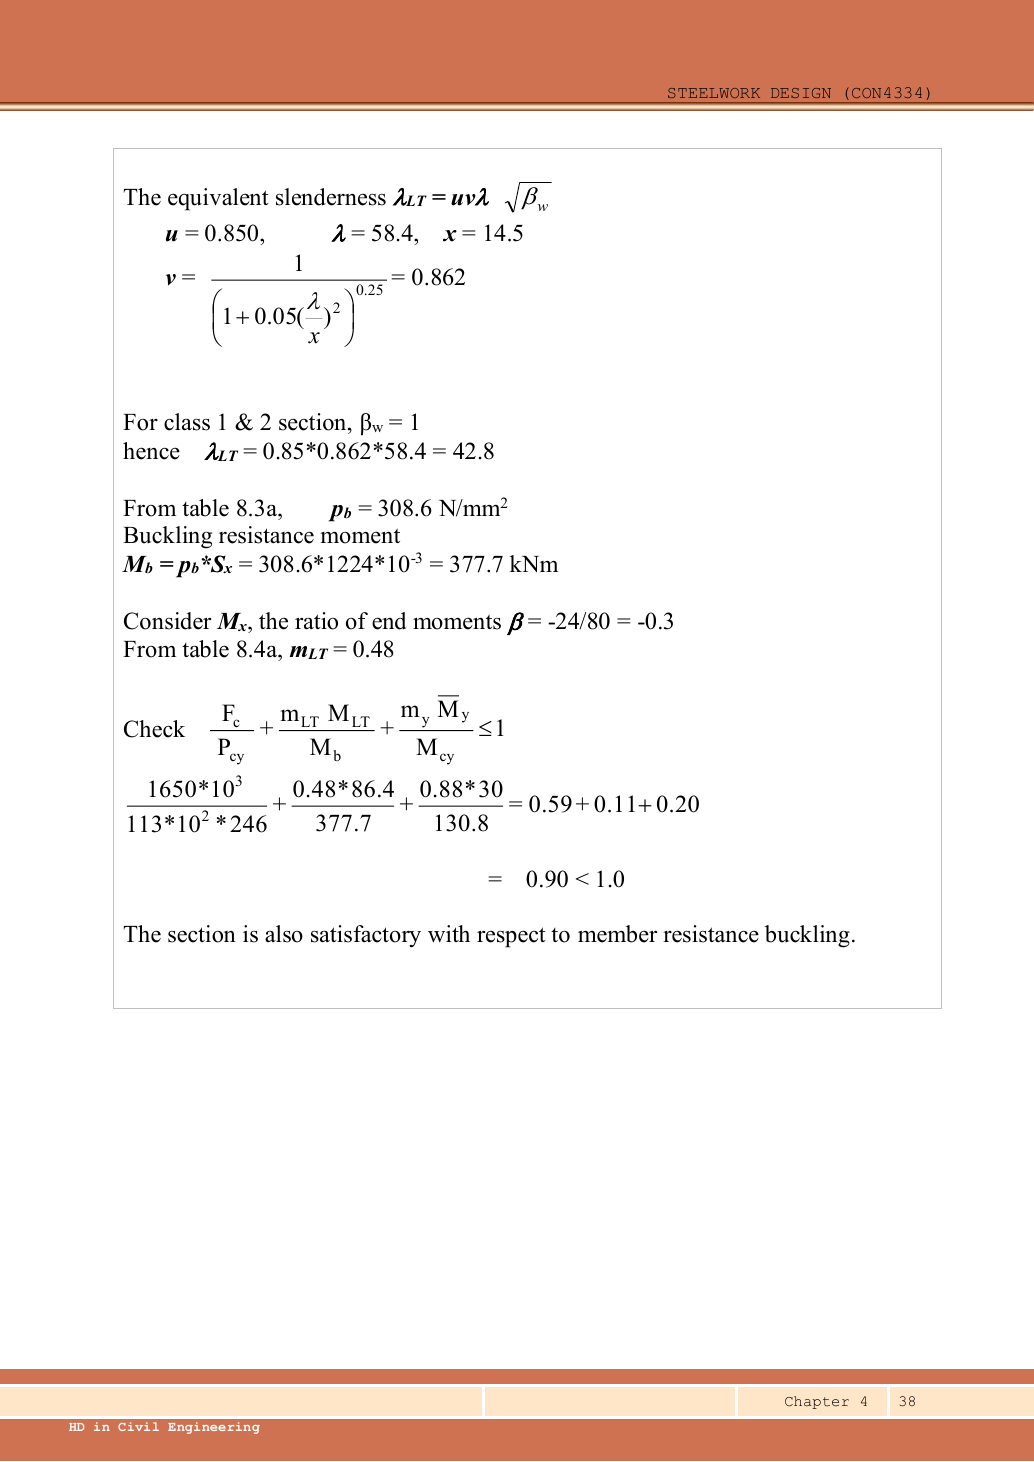
Read the diagram and collect the data
| Input | Meaning/value source |
|---|---|
| End moments | Given applied-arrow convention: / about ; / about . Convert to the Table 8.9 internal-diagram ratio. |
| Amplification | Given and ; Mᴸᵀ86.4 already includes amplification. |
| Section row | Data File p.11, UC: , , ; , ; , ; ; , , , ; , . |
| Restraint/curve choices | Table 8.6 recommended fixed/pinned K0.85; rolled H uses b about ,c about . |
Before calculating: recognition and strategy
This is continuous-frame end-moment design, so use the full LTB procedure and moment factors from the separate flexural/LTB tables. Check three things: local section interaction, flexural member interaction, and axial/LTB interaction. The section moment denominator is capped plastic resistance, whereas the member denominators are elastic pᵧZ. The source’s LTB minor-axis term uses first-order Mᵧ; its flexural term uses amplified Mᵧ.
1. Strength, combined-stress classification and moments
The raw exceeds because the axial load is divided by the web’s area, not total section area. The course classification parameter is bounded; this does not mean gross-area compression exceeds capacity.
Animation labWhy thin elements buckle locally
Supplement to the original lesson. Enable JavaScript to play, step through calculations and rotate 3D models. The following explanation remains readable offline.
- The flange outstand and web have different widths, thicknesses and edge support conditions.
- A thinner plate can wrinkle locally before the complete member loses stability.
- Class 1 allows plastic rotation; Class 2 reaches plastic resistance; Class 3 reaches elastic resistance; Class 4 requires effective properties.
- Check every relevant compression element with the supplied limits and stress distribution. The deformation shown is qualitative.
2. Cross-section interaction
Simple explanation: The column needs more than one pass
A slice can be strong while the whole member still buckles.
- Check cross-section compression plus bending.
- Then check the separate member-buckling expressions.
- Keep each moment, factor and resistance in its specified expression.
Remember: The three checks do not share interchangeable denominators.
Both maximum moment magnitudes occur at the top in the given load schedule, so they coexist with the stated compression there. The minor-axis ceiling is the governing branch for .
Animation labA strong slice can belong to an unstable member
Supplement to the original lesson. Enable JavaScript to play, step through calculations and rotate 3D models. The following explanation remains readable offline.
- Combine axial compression and the two bending demands using the specified section resistances.
- The whole member adds effective-length and buckling-curve effects.
- This uses its own moment factor and bending resistance; it is not a copy of the section check.
- Elastic, plastic and buckling resistances are not interchangeable. Read the three original expressions and their first-order/amplified moments.
3. Effective length and both axial buckling resistances
Select curve b for and c for ; both use pᵧ345. The source shows only the controlling result; the lookup below completes the omitted comparison.
Animation labEffective length and buckling axes
Supplement to the original lesson. Enable JavaScript to play, step through calculations and rotate 3D models. The following explanation remains readable offline.
- A column can bow sideways before its section reaches the crushing resistance.
- Each axis has its own radius of gyration and restraint spacing.
- , with compatible length units. A tie affects only the directions it actually restrains.
- Select each buckling curve and compressive strength before forming Pc. The governing axis is determined by resistance, not slenderness alone.
4. Read the two flexural factors and the LTB factor
Simple explanation: Similar-looking moment factors come from different tables
Two recipes can use the same ingredients but different amounts.
- Identify flexural buckling or lateral-torsional buckling first.
- Read the actual moment diagram, including any change of sign.
- Use that check’s table and its own sign and minimum-factor rules.
Remember: Table 8.9 flexural factors are not Table 8.4 LTB factors.
The question defines signs for applied clockwise/anticlockwise end moments. The internal end-moment diagram reverses the bottom-end sign relative to that schedule. Thus the same positive applied signs about create a reversing BMD, while the opposite applied signs about create a same-side BMD.
Do not read as : that belongs to the different LTB table. Uniform amplification about an axis multiplies both ends equally and leaves the end-moment ratio unchanged.
Animation labRead the moment shape within one segment
Supplement to the original lesson. Enable JavaScript to play, step through calculations and rotate 3D models. The following explanation remains readable offline.
- Moment ordinates must belong to the same effective unbraced segment.
- Same-side and reverse-curvature diagrams have different signed end ratios.
- The markers show ¼, ½ and ¾ of this segment, not of the entire beam.
- LTB and column flexural factors are different. Preserve their individual bounds and coefficient sets.
5. Flexural member interaction with elastic denominators
Animation labA strong slice can belong to an unstable member
Supplement to the original lesson. Enable JavaScript to play, step through calculations and rotate 3D models. The following explanation remains readable offline.
- Combine axial compression and the two bending demands using the specified section resistances.
- The whole member adds effective-length and buckling-curve effects.
- This uses its own moment factor and bending resistance; it is not a copy of the section check.
- Elastic, plastic and buckling resistances are not interchangeable. Read the three original expressions and their first-order/amplified moments.
6. Axial/LTB interaction
Simple explanation: A beam can escape sideways
The compressed flange can move sideways while the section twists.
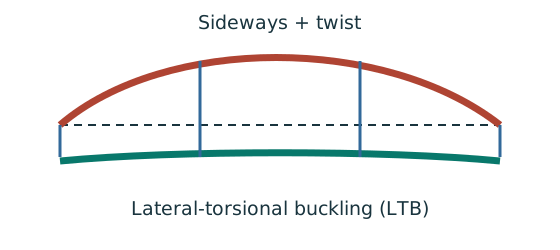
- Divide the beam at effective lateral restraints.
- Use each segment’s effective length to obtain its buckling resistance.
- Compare that resistance with the segment’s equivalent moment demand.
Remember: A section bending check alone does not check lateral-torsional buckling.
The in the last term is intentional: source Eq.8.81 has barred, first-order Mᵧ. The Mᴸᵀ is already amplified. All three interactions pass; flexural member interaction is closest to .
Animation labA strong slice can belong to an unstable member
Supplement to the original lesson. Enable JavaScript to play, step through calculations and rotate 3D models. The following explanation remains readable offline.
- Combine axial compression and the two bending demands using the specified section resistances.
- The whole member adds effective-length and buckling-curve effects.
- This uses its own moment factor and bending resistance; it is not a copy of the section check.
- Elastic, plastic and buckling resistances are not interchangeable. Read the three original expressions and their first-order/amplified moments.
Compact exam answer
S355 UC: , Class 1. Section utilisation . ; , ; curves b/c give , . . , ; elastic resistance /; flexural-buckling utilisation . , , , , ; axial force/LTB utilisation . All pass.
Mistakes to avoid
- Use , not , for the flange.
- Apply the 1.2pᵧZ ceiling on the minor axis.
- Do not use capped plastic capacities in the member interaction.
- Distinguish applied end signs from internal moment-diagram signs.
- Keep first-order Mᵧ in the source Eq.8.81 term.
Procedure for an unfamiliar variant
- Identify axial load, any moments, actual length and restraints in each axis.
- Choose/read a section and confirm strength from the actual thickness.
- Check the appropriate flange and web local-slenderness limits.
- Find and separately; select each axis curve and interpolate .
- Calculate both axial resistances and identify the governing axis.
- If moments exist, complete section, flexural and axial/LTB interactions using their own capacities and moment definitions.
Independent self-check
Try it yourself. Invented variant: only the imposed major-axis end moments in the given factored schedule are replaced by/; treat these as a increase of the stated total first-order moments, with axial load and moments unchanged. How do the checks change?
Reveal answer and reasoning
-axis end-moment ratio remains , so , are unchanged.. Section utilisation increases by to . Flexural-buckling utilisation increases by to . LTB utilisation increases by to . All still pass, with resistance properties unchanged.
Animation labA strong slice can belong to an unstable member
Supplement to the original lesson. Enable JavaScript to play, step through calculations and rotate 3D models. The following explanation remains readable offline.
- Combine axial compression and the two bending demands using the specified section resistances.
- The whole member adds effective-length and buckling-curve effects.
- This uses its own moment factor and bending resistance; it is not a copy of the section check.
- Elastic, plastic and buckling resistances are not interchangeable. Read the three original expressions and their first-order/amplified moments.
Animation labRead the moment shape within one segment
Supplement to the original lesson. Enable JavaScript to play, step through calculations and rotate 3D models. The following explanation remains readable offline.
- Moment ordinates must belong to the same effective unbraced segment.
- Same-side and reverse-curvature diagrams have different signed end ratios.
- The markers show ¼, ½ and ¾ of this segment, not of the entire beam.
- LTB and column flexural factors are different. Preserve their individual bounds and coefficient sets.
8. Simple construction: pinned beams still bend the column Often examined
Simple explanation: A pinned beam can still bend its column
Its reaction can miss the column centre and create a lever arm.
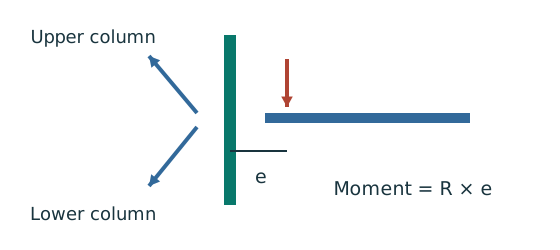
- Find the reaction’s actual nominal eccentricity.
- Multiply reaction by eccentricity to obtain the joint moment.
- Share that moment using the stated column-stiffness model.
Remember: Equal sharing needs equal relevant stiffness; it is not automatic.
The eccentricity is measured from the column centroid to the reaction line. For a beam on the column flange face, place the reaction 100 mm from the face (or at the centre of stiff bearing, whichever is further), then add the centroid-to-face distance ( for the major axis). Hence the usual (mm).
With the same section above and below, cancels and only the lengths matter: a 3 m lower column is twice as stiff as a 6 m upper one, so it takes and the upper ; equal lengths share half each. Equal reactions on opposite sides cancel their moments but still add to the axial force. The upper column carries the roof; the lower carries roof + intermediate floor. Never share the axial force by stiffness.
This simplified method lets every beam be fully loaded (no pattern loading). A beam loaded above 90% of its capacity must not be assumed to restrain the column’s rotation. For LTB use with the actual storey height, not the effective length; and .
Concept map: Simple construction: the beams are pinned, so why is the column still bent?
Concept map
Simple construction: the beams are pinned, so why is the column still bent?
“Pinned” makes it easy to think the column is only compressed. But the beam reaction is off the column centre, so it bends the column. The map splits two routes: the moment is shared by stiffness; the axial force accumulates floor by floor and is not shared.
- Cause
- Key idea
- Result
- How design deals with it
- Exam answer
- marks are often lost here
Text version (from cause to result)
Cause
Pinned beam-to-column joints
Simple design assumes pinned beam ends that pass no continuity moment; sideways loads go to bracing or a core.
Comes from (upstream)— (a starting point)
Leads to (downstream) The reaction is off-centre: eccentricity
Cause
Beams pass their reactions to the column
Each beam’s end reaction (factored) presses on the column.
Comes from (upstream)— (a starting point)
Leads to (downstream) The reaction is off-centre: eccentricity Axial force adds up floor by floor
Key idea
The reaction is off-centre: eccentricity
The reaction is taken 100 mm from the column face. Beam on the column flange: ; on the column web: (mm). Use the question’s value if given.
Comes from (upstream)Pinned beam-to-column jointsBeams pass their reactions to the column
Leads to (downstream) The column is bent
ResultWhere marks are lost
The column is bent
Reaction × eccentricity = moment. On the same axis, equal reactions from opposite sides cancel their moments.
Comes from (upstream) The reaction is off-centre: eccentricity
Leads to (downstream) Moment shared by stiffness
ResultWhere marks are lost
Axial force adds up floor by floor
The lower column carries the reactions of every floor above plus this floor. Only the moments cancel; the axial forces all add up.
Comes from (upstream)Beams pass their reactions to the column
Leads to (downstream)Simplified formulas: m = 1
How design deals with it
Simplified formulas: m = 1
In simple construction ; for LTB use with the actual storey height, not the effective length. Compression still uses .
Comes from (upstream) Moment shared by stiffness Axial force adds up floor by floor
Leads to (downstream)Exam answer order
Exam answer
Exam answer order
(1) for each reaction; (2) net moment ; (3) share by ; (4) accumulate the axial force; (5) use the formulas with . Example: 2023 FT BQ3.
Comes from (upstream)Simplified formulas: m = 1
Leads to (downstream)— (the last step)
Tour steps
1. Pinned, but the reaction is off-centre
A pin passes no moment, but the reaction acts a distance from the column centre.
In this stepPinned beam-to-column jointsBeams pass their reactions to the column The reaction is off-centre: eccentricity
2. So the column bends
; equal reactions on opposite sides cancel.
In this step The column is bent
3. Two routes, kept apart
The moment is shared between upper and lower columns by stiffness; the axial force just adds up.
In this step Moment shared by stiffness Axial force adds up floor by floor
4. Use the simplified formulas
, and LTB uses the actual storey height.
In this stepSimplified formulas: m = 1Exam answer order
Column example 3: loads and eccentric moments in two storeys
Open this example on its own page
Check UC S355 in a two-storey simple-construction column. The lower storey is , the upper . Use the supplied reaction table and stated construction assumptions, including a pinned base and moment amplification.
Original source: LectureNotes/Ch 4_Column.pdf — p. 25, p. 26, p. 27, p. 28, p. 29, p. 30, p. 31. Values tagged given are in the question or diagram; lookup values come from a named table; calculated values follow from the working; assumptions are stated explicitly.
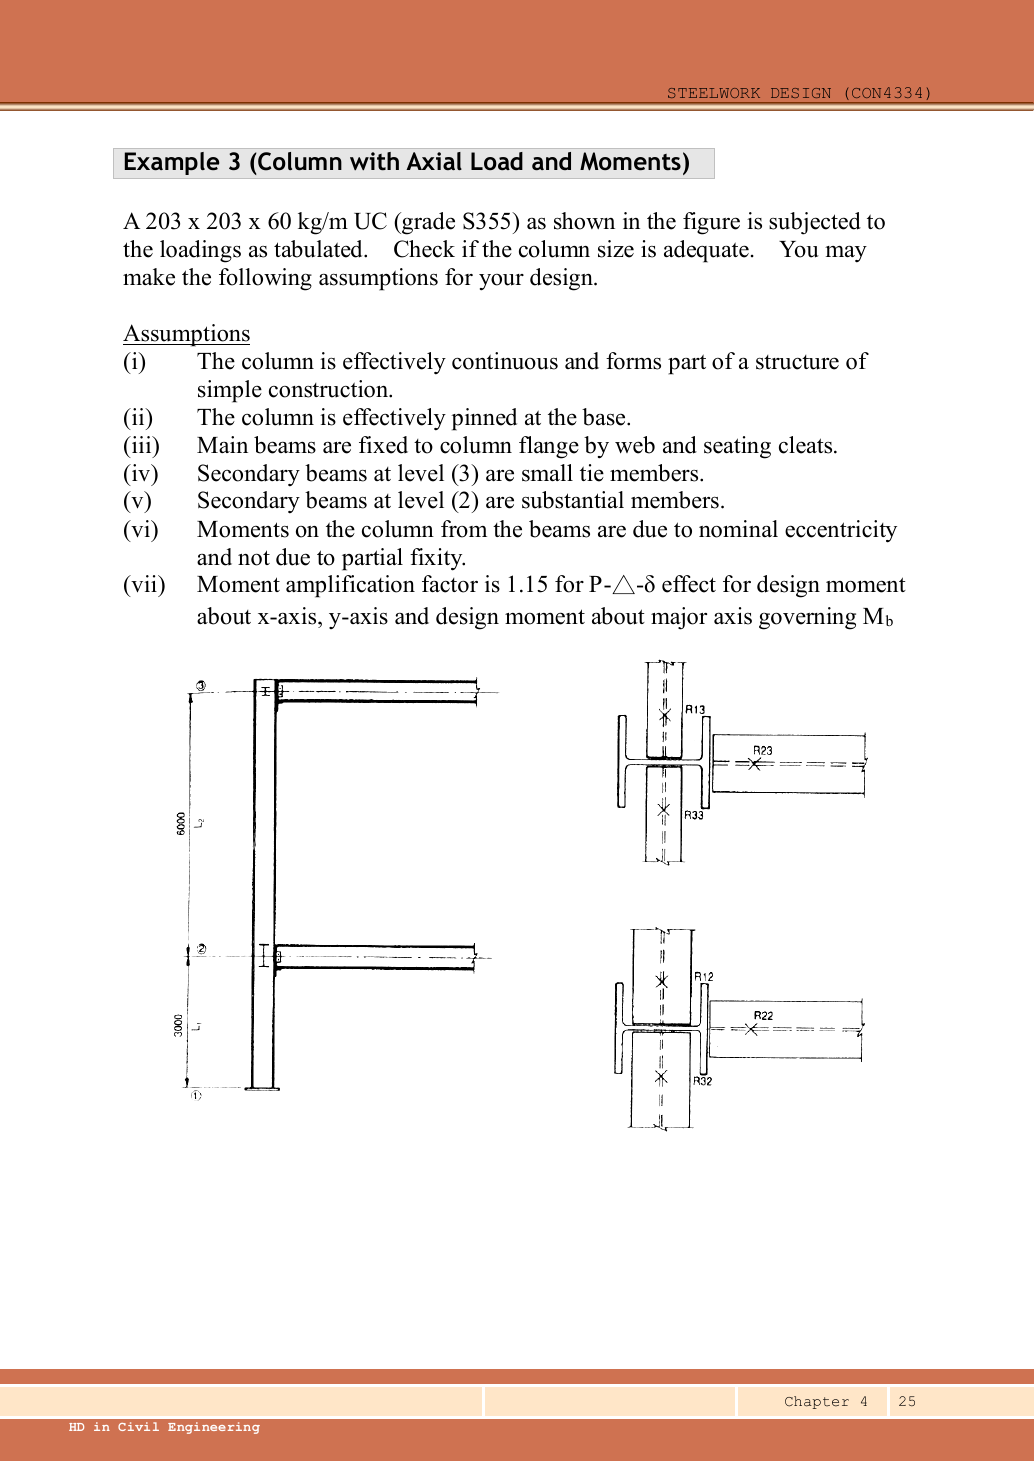
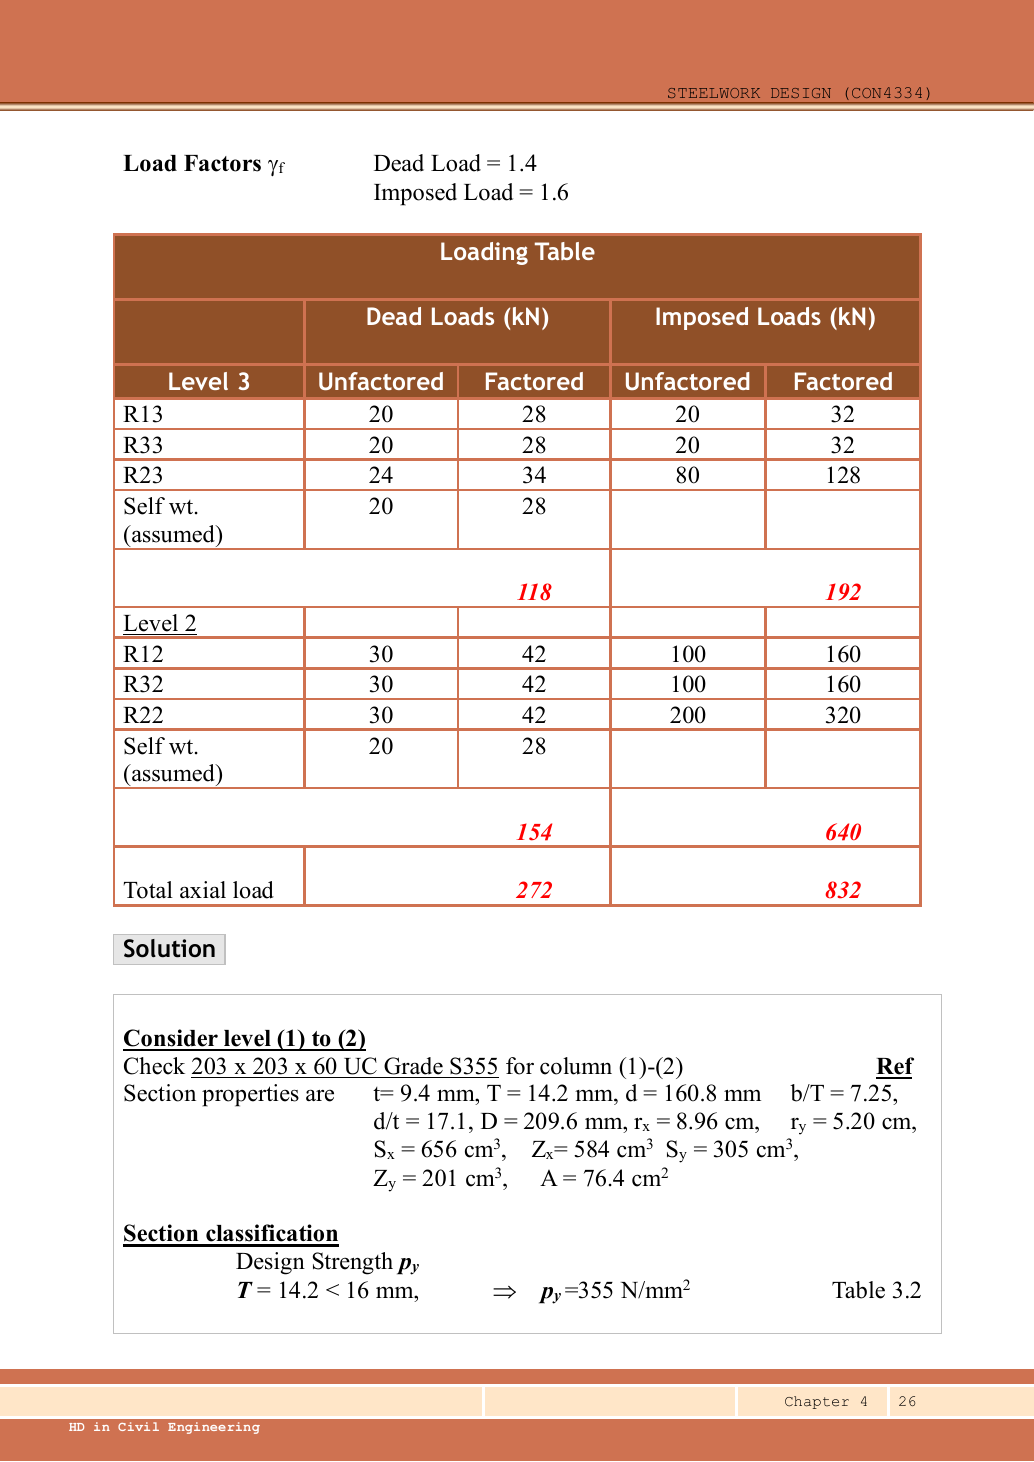
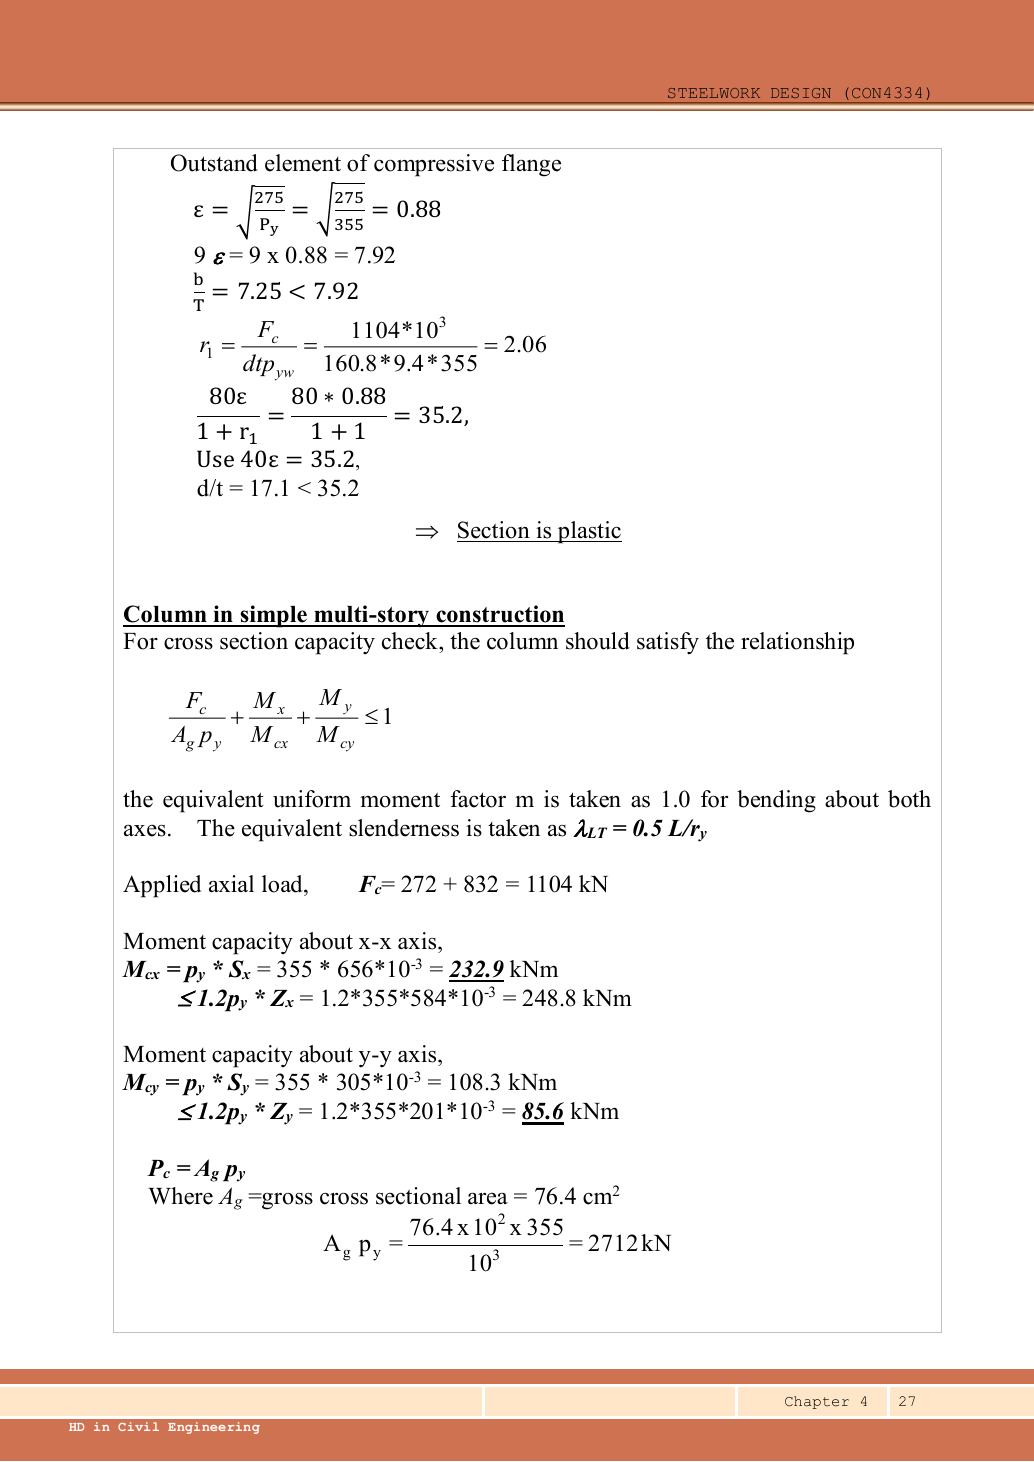
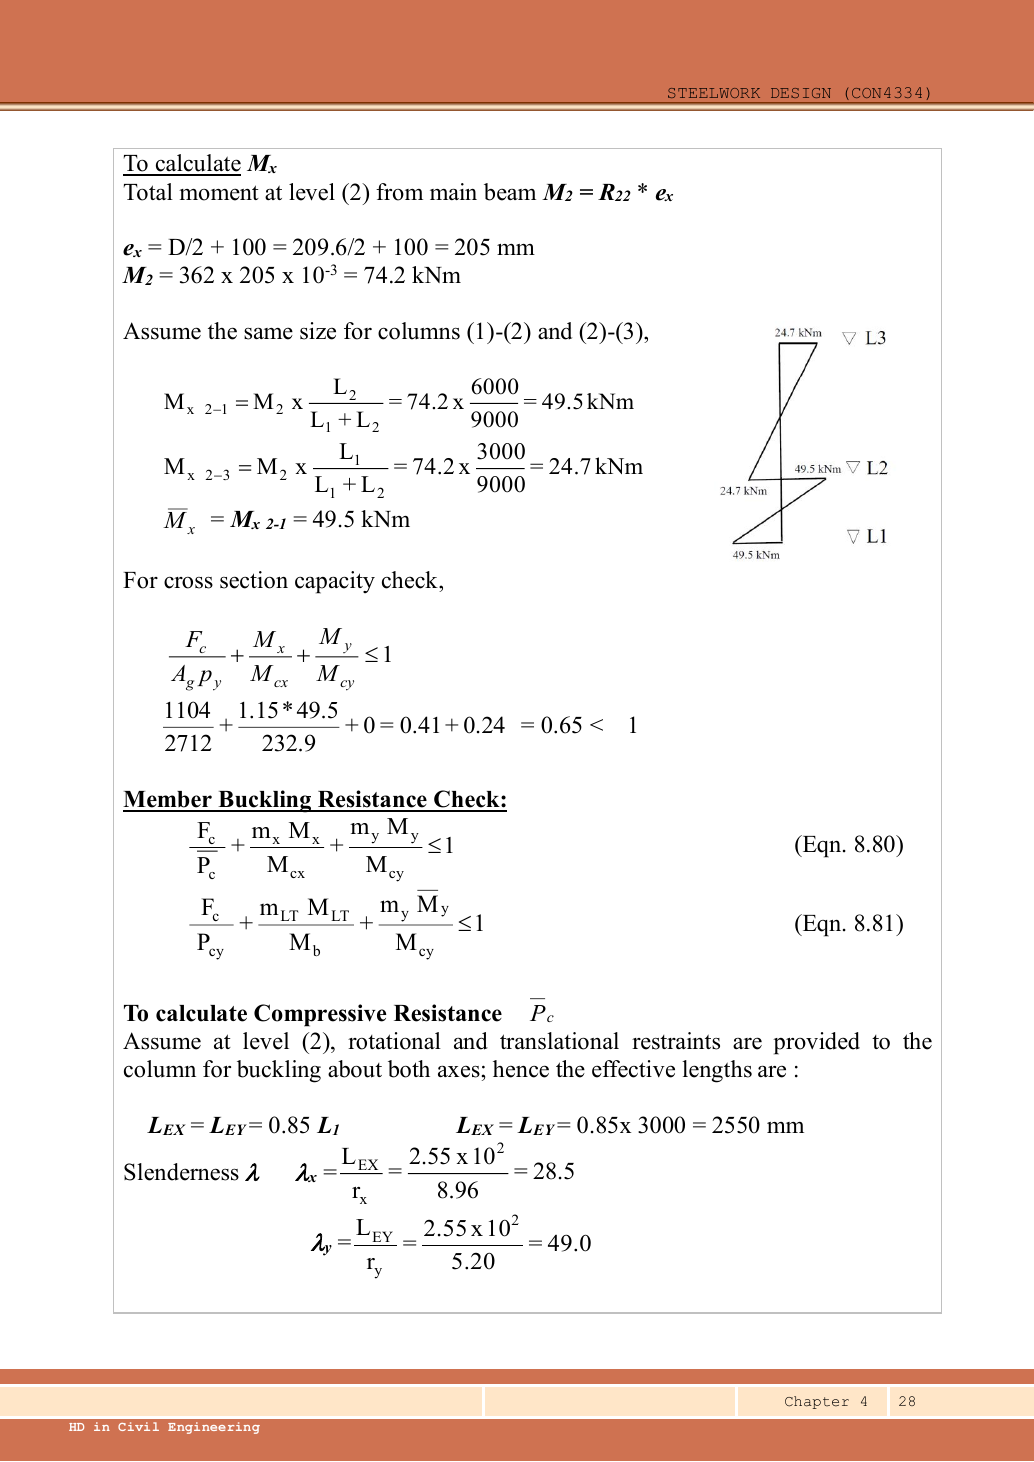
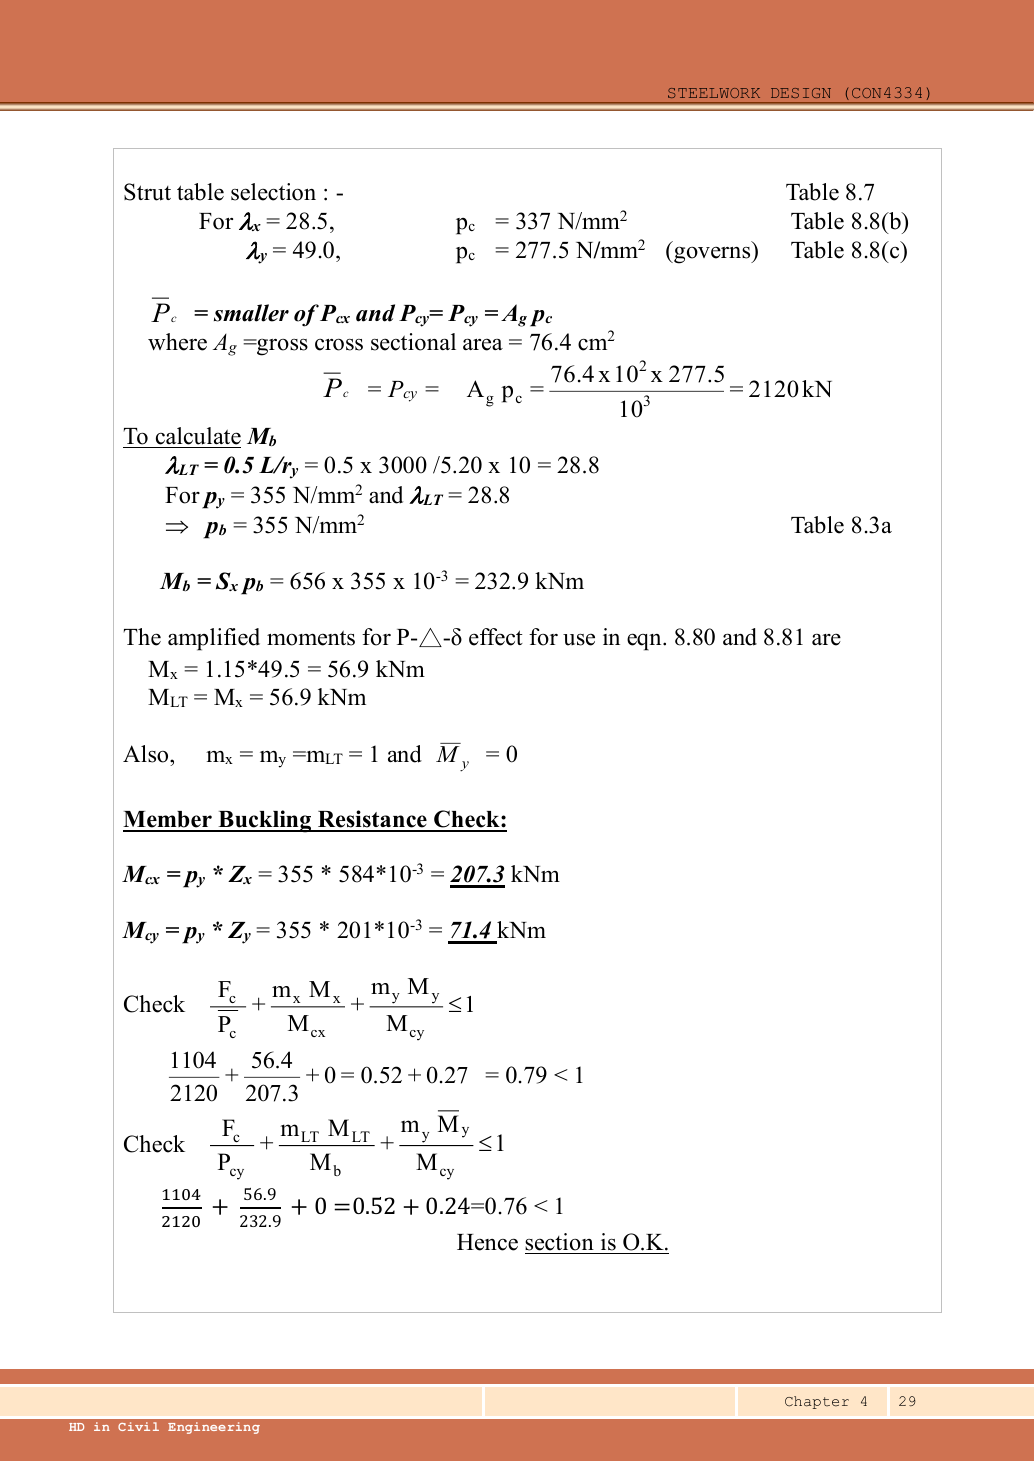
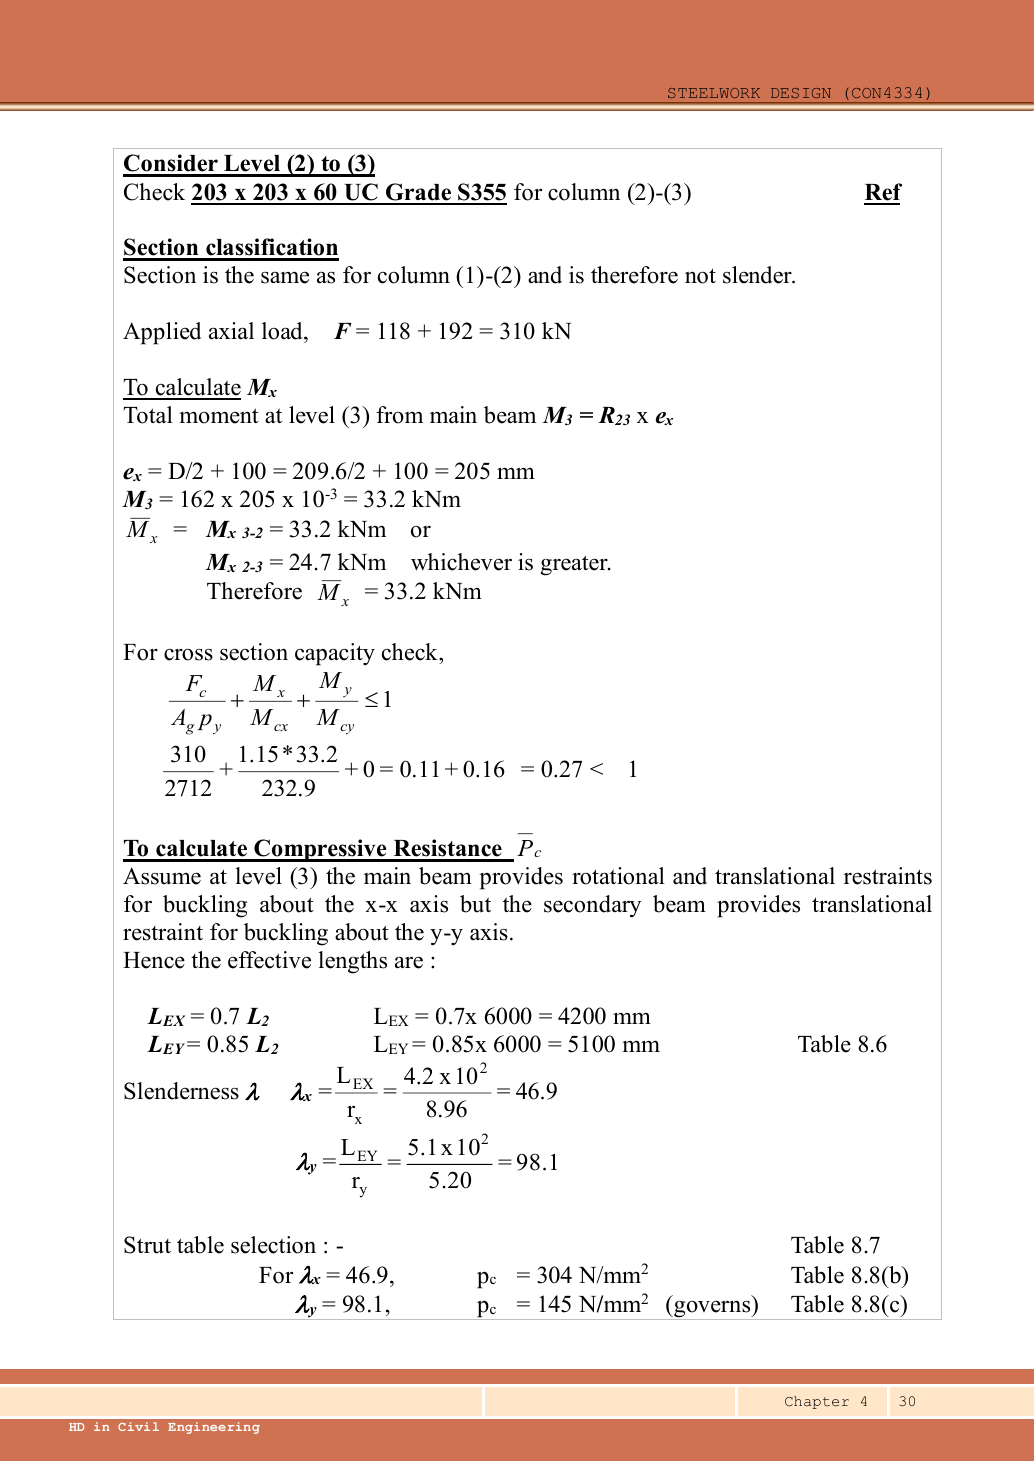
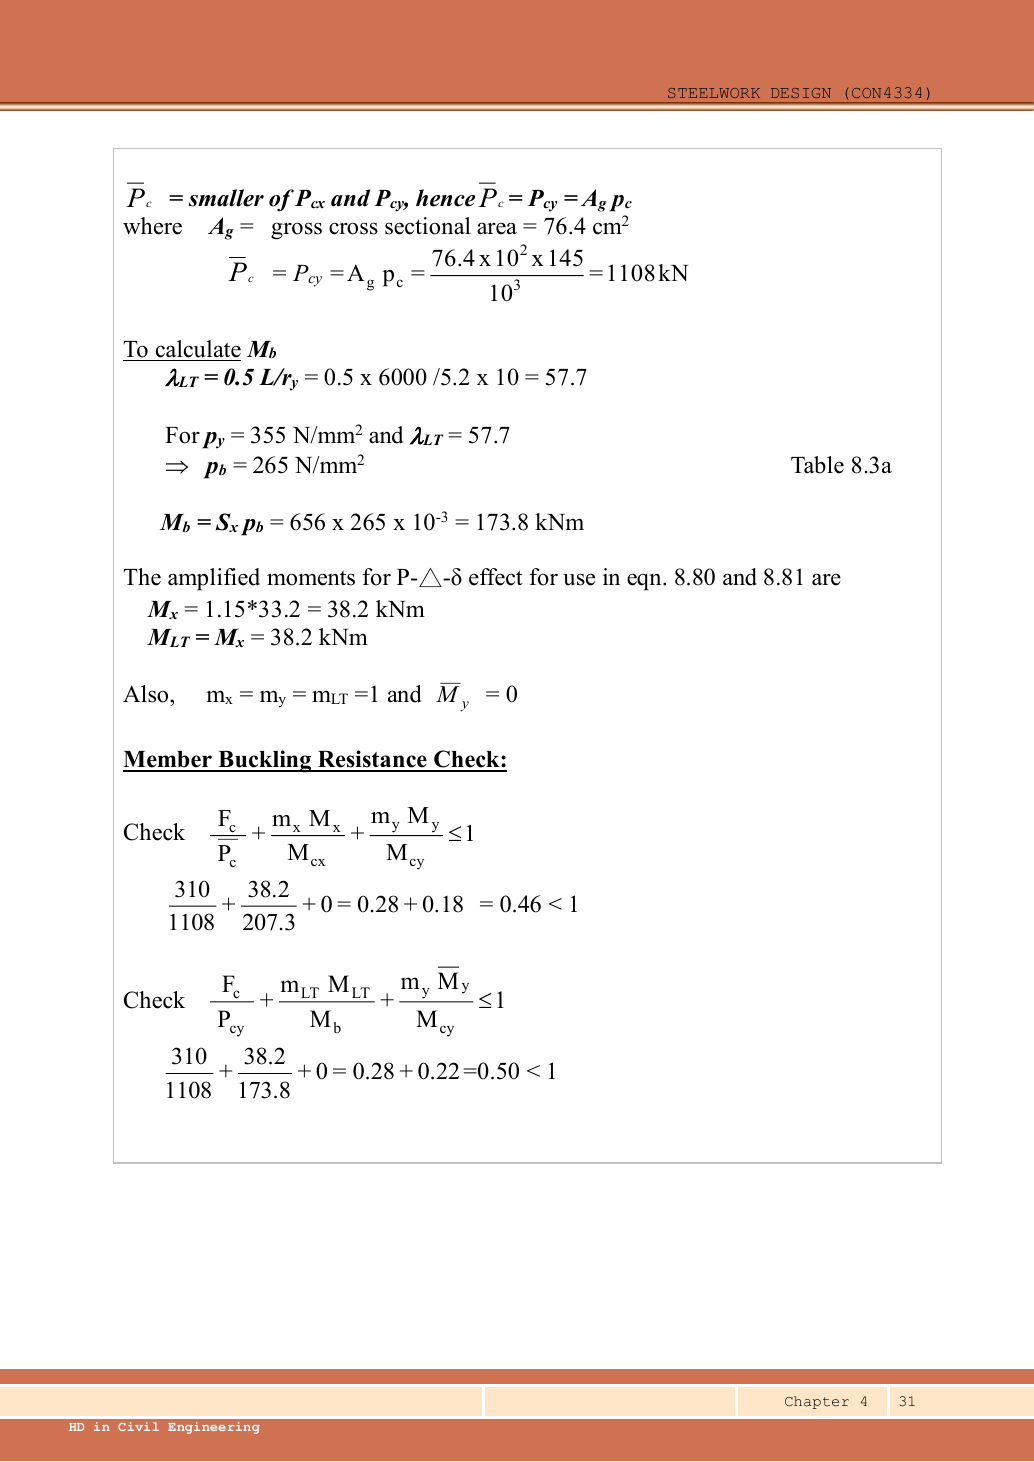
Read the diagram and collect the data
| Given model | Implication |
|---|---|
| Continuous column, simple beam construction | Use nominal eccentricity and moment sharing; all moment factors are . |
| Base effectively pinned | Lower segment has no base rotational fixity. Substantial level 2 members give the source’s upper restraint assumption. |
| Roof secondary beams are small ties | Provide positional but not rotational restraint for the upper column’s weak-axis buckling. |
| Main beams connect by web and seating cleats | Source adopts reaction line beyond the column face. |
| Self-weight | Source assumes characteristic dead self-weight at each level; include it once per level. |
| Section data | Data p.11: , , , , , , , , , , , , . |
Before calculating: recognition and strategy
There are two separate accounting tasks. Axial load accumulates down the column. Eccentric reactions create a net joint moment which is shared between the upper and lower column in proportion to . Equal opposite secondary reactions cancel their moments, but their vertical loads still add. Keep these operations separate. This solution retains arithmetic precision; a short comparison also explains the source’s rounded values.
1. Recalculate every reaction-table entry and storey total
| Level/reaction | Given () | Given () | Ultimate total | ||
|---|---|---|---|---|---|
| 3: | |||||
| 3: | |||||
| 3: | |||||
| 3: assumed self-weight | |||||
| 3 totals | |||||
| 2: | |||||
| 2: | |||||
| 2: | |||||
| 2: assumed self-weight | |||||
| 2 added totals |
Animation labFrom characteristic to design load
Supplement to the original lesson. Enable JavaScript to play, step through calculations and rotate 3D models. The following explanation remains readable offline.
- G is permanent load; Q is imposed load. A surface load and a line load also have different units.
- This illustration uses the course gravity case . Other combinations in the original text retain their own factors.
- For illustrative , change Q and watch each separate contribution.
- Do not carry this ULS total automatically into deflection. Follow the stated SLS load case.
2. Strength and section classification
The lower section’s larger axial compression is sufficient for checking this section’s worst compression/bending web limit. The selected section has the same geometry throughout both storeys.
Animation labWhy thin elements buckle locally
Supplement to the original lesson. Enable JavaScript to play, step through calculations and rotate 3D models. The following explanation remains readable offline.
- The flange outstand and web have different widths, thicknesses and edge support conditions.
- A thinner plate can wrinkle locally before the complete member loses stability.
- Class 1 allows plastic rotation; Class 2 reaches plastic resistance; Class 3 reaches elastic resistance; Class 4 requires effective properties.
- Check every relevant compression element with the supplied limits and stress distribution. The deformation shown is qualitative.
3. Calculate section and elastic member capacities
The linear section interaction uses and . The member interaction uses and . The source reuses similar notation for different definitions; keep a clearly labelled capacity list.
Animation labCompression and tension across a section
Supplement to the original lesson. Enable JavaScript to play, step through calculations and rotate 3D models. The following explanation remains readable offline.
- For sagging, the top flange is in compression and the bottom in tension; hogging reverses this.
- Elastic bending stress varies with distance from the neutral axis: .
- The section class governs whether elastic, plastic or effective properties may be used.
- Use the shear at the section under examination; the largest shear elsewhere is not automatically coexistent.
4. Nominal eccentricity and stiffness sharing at level 2
Simple explanation: A pinned beam can still bend its column
Its reaction can miss the column centre and create a lever arm.
- Find the reaction’s actual nominal eccentricity.
- Multiply reaction by eccentricity to obtain the joint moment.
- Share that moment using the stated column-stiffness model.
Remember: Equal sharing needs equal relevant stiffness; it is not automatic.
The main beam reaction acts on one flange. takes us from the centroid to the flange face; the nominal then takes us to the source’s reaction line. and have equal magnitudes on opposite sides, so their minor-axis nominal moments cancel.
The lower storey is shorter, hence stiffer and receives the larger moment share. The source rounds to , to and shares to /. The little moment diagrams on p.28 show the moment components associated with this joint sharing; they are not additional applied point loads.
Animation labEccentric reactions and stiffness sharing
Supplement to the original lesson. Enable JavaScript to play, step through calculations and rotate 3D models. The following explanation remains readable offline.
- A beam reaction can act away from the column centre even at a nominally pinned beam connection.
- . Opposing reactions can cancel part of the signed moment, while both still add compression.
- The course simple model distributes the joint moment in proportion to of the columns above and below.
- Equal relevant stiffness gives half each. A roof joint with no upper column is a different case.
5. Lower-storey section interaction
Simple explanation: The column needs more than one pass
A slice can be strong while the whole member still buckles.
- Check cross-section compression plus bending.
- Then check the separate member-buckling expressions.
- Keep each moment, factor and resistance in its specified expression.
Remember: The three checks do not share interchangeable denominators.
Using the rounded source loads and moments gives . Both precision levels agree with the source result of approximately .
Animation labA strong slice can belong to an unstable member
Supplement to the original lesson. Enable JavaScript to play, step through calculations and rotate 3D models. The following explanation remains readable offline.
- Combine axial compression and the two bending demands using the specified section resistances.
- The whole member adds effective-length and buckling-curve effects.
- This uses its own moment factor and bending resistance; it is not a copy of the section check.
- Elastic, plastic and buckling resistances are not interchangeable. Read the three original expressions and their first-order/amplified moments.
6. Lower-storey member buckling
Simple explanation: Why a long column can fail before crushing
Push a long thin ruler from both ends: it may bow sideways first.
- Find effective length and radius of gyration for each axis.
- Calculate slenderness for both directions.
- Use the appropriate buckling curve before forming resistance.
Remember: Compare the final resistances; slenderness alone may not identify the controlling axis.
The source assumes rotational and positional restraint at level 2 in both axes; the base is pinned. Table 8.6 recommended fixed/pinned factor is . Use that assumed model explicitly, rather than inferring a rigid base from the drawing’s plate line.
Simple construction sets all factors to . For bending buckling use actual storey length , not :
Animation labA strong slice can belong to an unstable member
Supplement to the original lesson. Enable JavaScript to play, step through calculations and rotate 3D models. The following explanation remains readable offline.
- Combine axial compression and the two bending demands using the specified section resistances.
- The whole member adds effective-length and buckling-curve effects.
- This uses its own moment factor and bending resistance; it is not a copy of the section check.
- Elastic, plastic and buckling resistances are not interchangeable. Read the three original expressions and their first-order/amplified moments.
7. Upper-storey governing moment and section interaction
The upper-storey moment is governed by the roof reaction, not automatically the moment inherited at level 2. The source uses , giving amplified . Its printed comes from early rounding of the separate utilisation terms; full arithmetic is about at two decimal places.
Animation labA strong slice can belong to an unstable member
Supplement to the original lesson. Enable JavaScript to play, step through calculations and rotate 3D models. The following explanation remains readable offline.
- Combine axial compression and the two bending demands using the specified section resistances.
- The whole member adds effective-length and buckling-curve effects.
- This uses its own moment factor and bending resistance; it is not a copy of the section check.
- Elastic, plastic and buckling resistances are not interchangeable. Read the three original expressions and their first-order/amplified moments.
8. Upper-storey buckling about both axes
The main roof beam supplies the source’s major-axis rotational restraint. The small secondary roof ties only restrain position in the weak direction. With level 2 restrained, the lecture uses for and for .
Both storeys pass all three demonstrated interaction checks. The lower-storey flexural interaction, approximately , is the largest. The original source-rounded results are approximately lower // and upper //.
Animation labA strong slice can belong to an unstable member
Supplement to the original lesson. Enable JavaScript to play, step through calculations and rotate 3D models. The following explanation remains readable offline.
- Combine axial compression and the two bending demands using the specified section resistances.
- The whole member adds effective-length and buckling-curve effects.
- This uses its own moment factor and bending resistance; it is not a copy of the section check.
- Elastic, plastic and buckling resistances are not interchangeable. Read the three original expressions and their first-order/amplified moments.
Compact exam answer
Using exact arithmetic: upper/lower compression /. pᵧ355,Class 1; A𝗀pᵧ2,712.2 kN; section capacities /; elastic /. ; level 2 moment shares /. Amplified lower moment ; upper governing . Lower ,Mᵦ232.88; interactions //. Upper ,Mᵦ173.7391; interactions //. Both storeys adequate under the stated simple-construction restraint assumptions.
Mistakes to avoid
- Accumulate both levels for lower axial load.
- Cancel opposite moments, not the underlying compressive reactions.
- Share moment by , not equally and not by axial-force ratios.
- Use actual storey length in 0.5L/rᵧ.
- Do not treat a small roof tie as rotational restraint.
Procedure for an unfamiliar variant
- Trace the loads above each column segment and keep dead/imposed components separate.
- Read actual storey heights, section properties and end restraints in both axes.
- For simple construction derive nominal eccentric moments and share them by .
- Classify the section and form the correct section and member resistances.
- Apply only the prescribed load reductions and moment amplification rules.
- Check every storey segment and report both the governing check and source assumptions.
Independent self-check
Try it yourself. Invented variant: change only the upper-storey length from to , retaining the same column section and level 2 moment . How is that joint moment shared?
Reveal answer and reasoning
The upper and lower values now match, so each receives . The lower amplified share becomes . This redistribution does not alter the accumulated axial loads. Upper buckling lengths and 0.5L/rᵧ also change and must be recalculated; the original upper resistance cannot be reused.
Animation labEccentric reactions and stiffness sharing
Supplement to the original lesson. Enable JavaScript to play, step through calculations and rotate 3D models. The following explanation remains readable offline.
- A beam reaction can act away from the column centre even at a nominally pinned beam connection.
- . Opposing reactions can cancel part of the signed moment, while both still add compression.
- The course simple model distributes the joint moment in proportion to of the columns above and below.
- Equal relevant stiffness gives half each. A roof joint with no upper column is a different case.
Column example 4: tributary area and cumulative column loads
Open this example on its own page
Design internal column A in S355 for axial load only. Roof dead/imposed intensities are /; floor intensities /. Upper storey height ; lower . The foundation is fixed. Floor beams prevent translation but do not restrain column rotation. All given dead loads include beam and column self-weight.
Original source: LectureNotes/Ch 4_Column.pdf — p. 32, p. 33, p. 34, p. 35. Values tagged given are in the question or diagram; lookup values come from a named table; calculated values follow from the working; assumptions are stated explicitly.
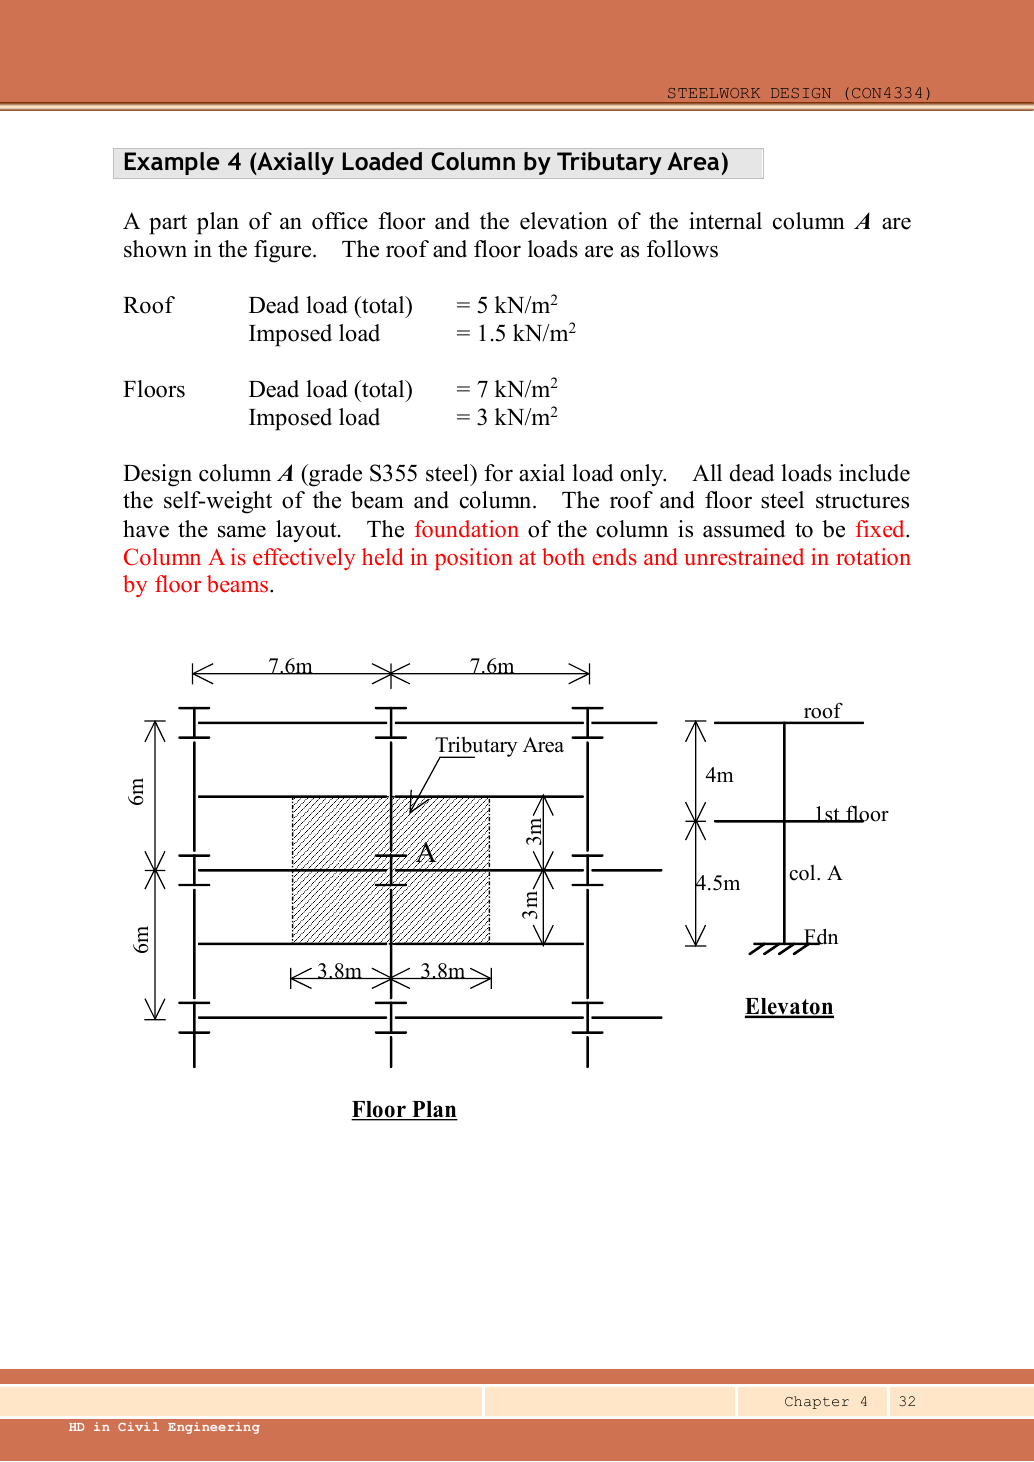
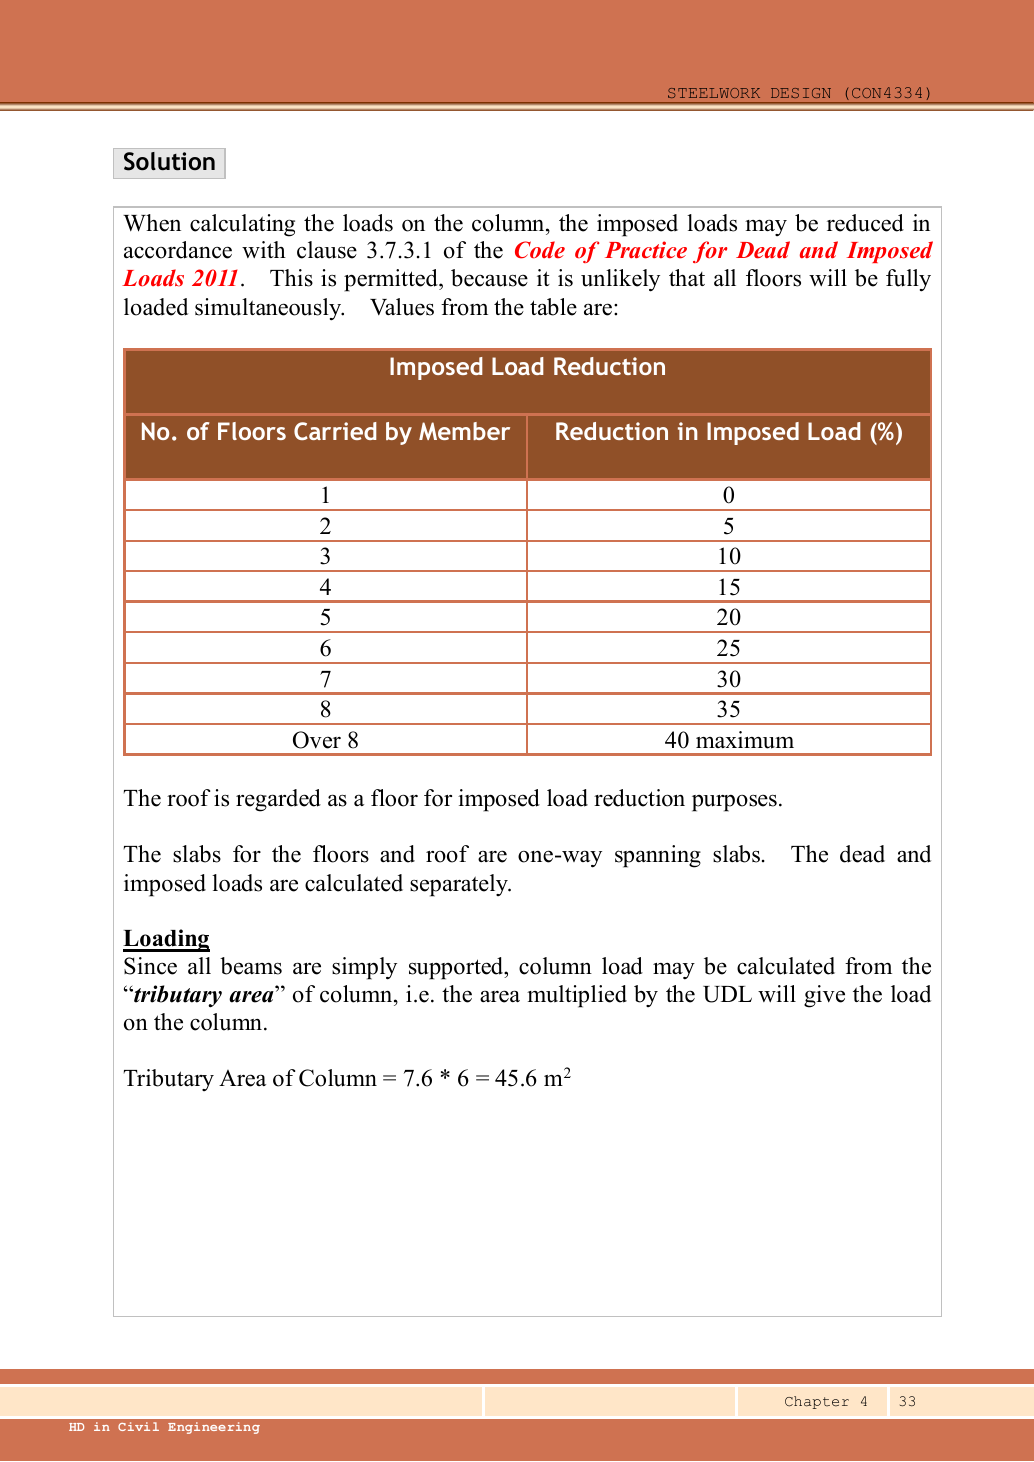
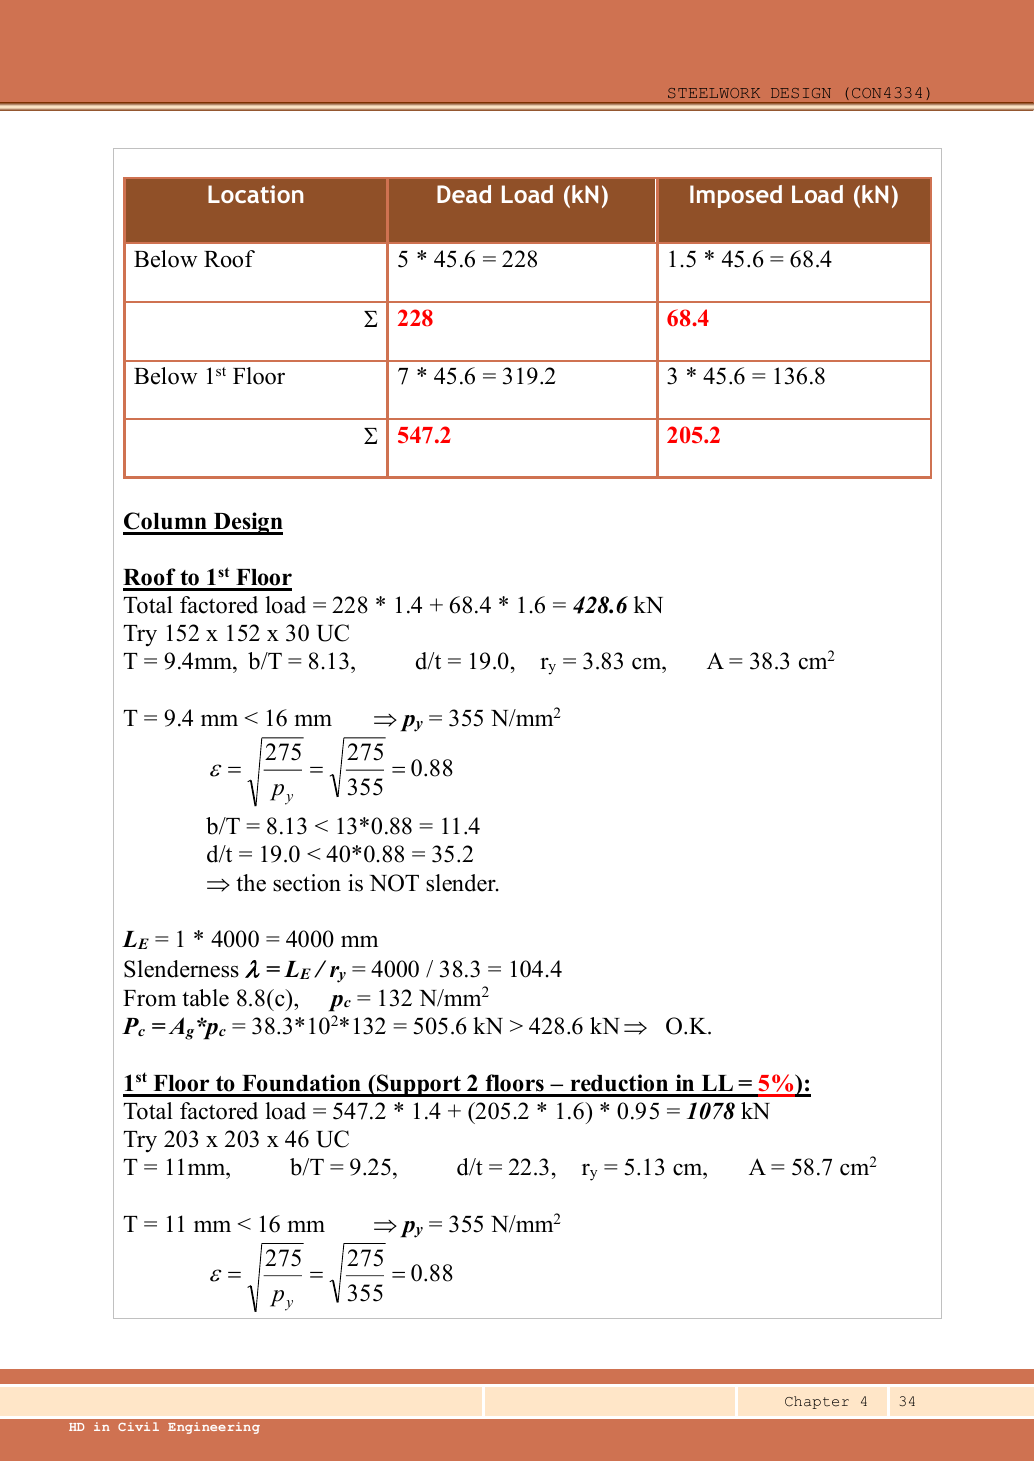
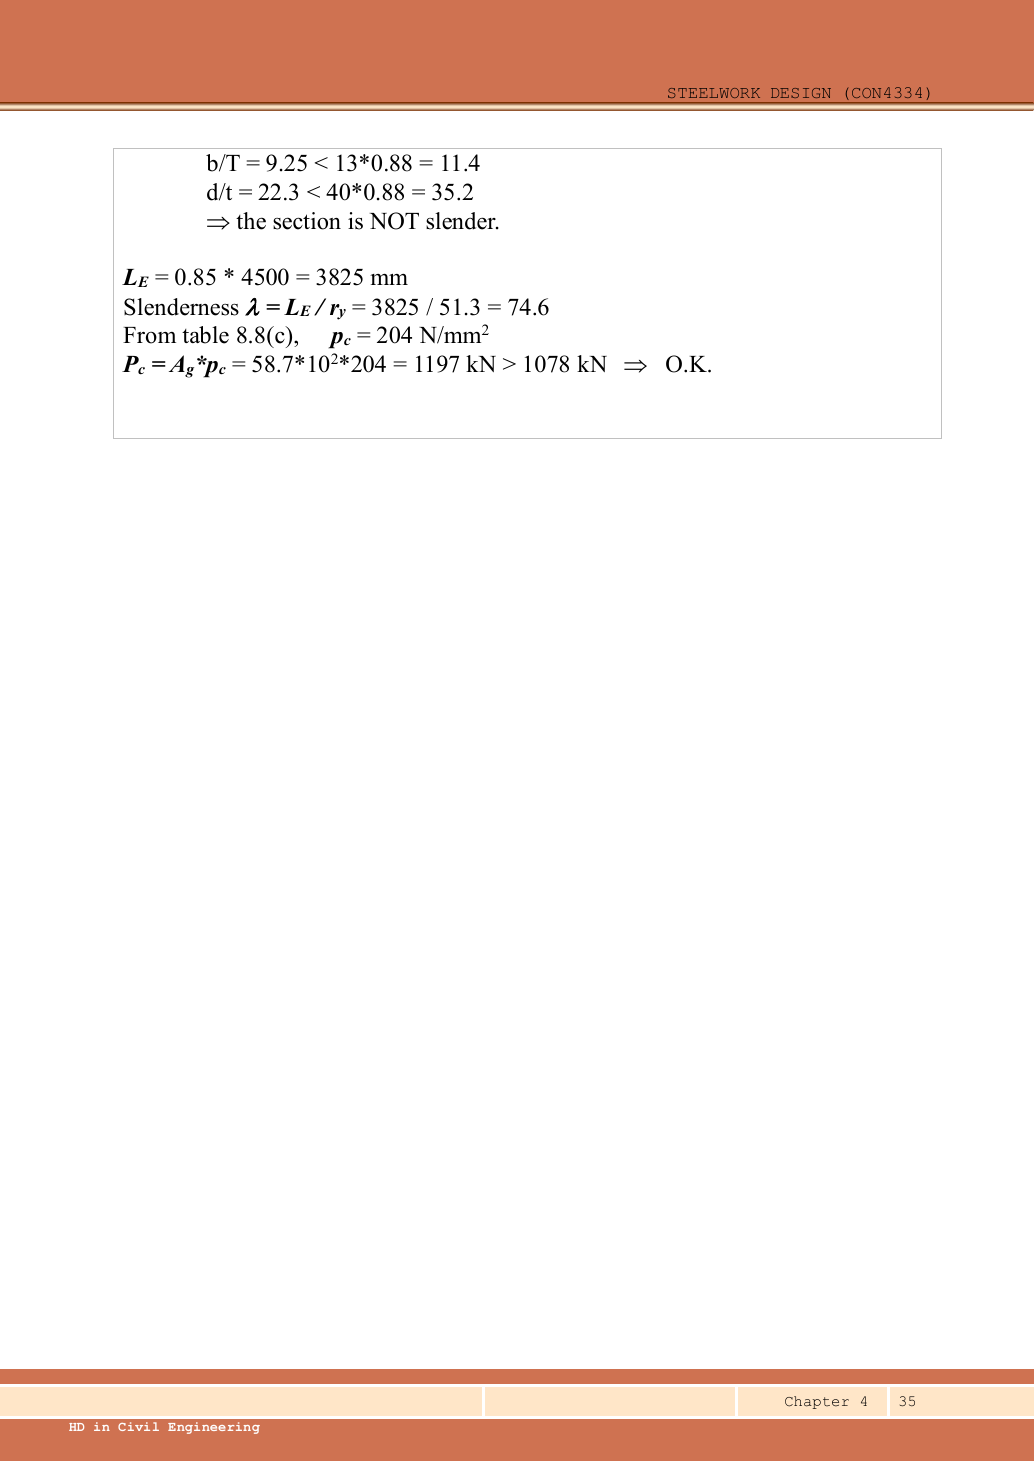
Read the diagram and collect the data
| Input | Where to read it |
|---|---|
| Tributary dimensions | Plan labels and ; use plan area, not storey height. |
| Vertical dimensions | Elevation upper and lower. |
| Roof/floor loads | Question text; the same floor plan applies at both levels. |
| Axial-only scope | Explicitly requested; no eccentric moment is introduced into this exercise. |
| Imposed reduction | Lecture p.33 applies its 2011 load-code floor-count table; roof counts as a floor. |
Before calculating: recognition and strategy
Multiply each level’s pressure by the area feeding the column. The upper segment carries only roof loading; the lower carries roof plus first floor. Reduce the cumulative imposed load only when the source’s permitted floor-count rule applies. After factoring, design each storey separately because loads, lengths and end conditions differ.
1. Derive the tributary area from the hatched plan
Simple explanation: How a floor load reaches a beam
Each beam collects the load from its own strip of floor.
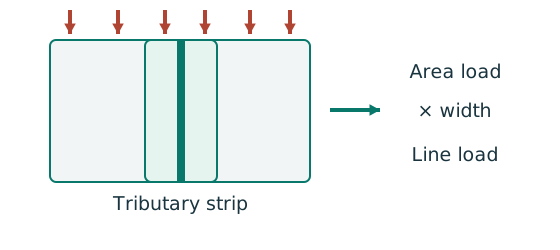
- Find the tributary width from the actual plan.
- Area load × tributary width gives load per beam length.
- A supporting beam receives the other beam’s end reaction.
Remember: A reaction becomes a point load, not automatically a UDL.
Half of each adjacent simply supported bay reaches column A. The hatch is a load-allocation area, not the column’s steel cross-sectional area. Both roof and floor use .
Animation labFollow the floor load in 3D
Supplement to the original lesson. Enable JavaScript to play, step through calculations and rotate 3D models. The following explanation remains readable offline.
- The floor carries pressure in . The highlighted strip belongs to one secondary beam.
- Multiply pressure by tributary width: . The illustration uses .
- A primary beam receives the secondary beam reaction at their connection, not a new full-span UDL.
- Trace reactions down to columns and foundations. Count each loaded area once.
2. Read the source’s floor-count reduction
| Floors carried | Over | ||||||||
|---|---|---|---|---|---|---|---|---|---|
| Imposed reduction | maximum |
The upper member supports one roof level → reduction. The lower supports roof plus first floor →two levels →. Retain of the cumulative imposed load below the floor. This is the rule applied by this lecture example, attributed there to the 2011 Dead and Imposed Loads Code; do not extend it automatically to an occupancy or question where reduction is disallowed. Dead load is not reduced.
Animation labFollow the floor load in 3D
Supplement to the original lesson. Enable JavaScript to play, step through calculations and rotate 3D models. The following explanation remains readable offline.
- The floor carries pressure in . The highlighted strip belongs to one secondary beam.
- Multiply pressure by tributary width: . The illustration uses .
- A primary beam receives the secondary beam reaction at their connection, not a new full-span UDL.
- Trace reactions down to columns and foundations. Count each loaded area once.
3. Compute characteristic and ultimate loads at each level
All self-weight is already included. The lower load uses the whole accumulated load rather than adding an already factored/reduced upper force to a separately reduced floor force.
Animation labFrom characteristic to design load
Supplement to the original lesson. Enable JavaScript to play, step through calculations and rotate 3D models. The following explanation remains readable offline.
- G is permanent load; Q is imposed load. A surface load and a line load also have different units.
- This illustration uses the course gravity case . Other combinations in the original text retain their own factors.
- For illustrative , change Q and watch each separate contribution.
- Do not carry this ULS total automatically into deflection. Follow the stated SLS load case.
4. Select and check the upper column
Simple explanation: A pinned beam can still bend its column
Its reaction can miss the column centre and create a lever arm.
- Find the reaction’s actual nominal eccentricity.
- Multiply reaction by eccentricity to obtain the joint moment.
- Share that moment using the stated column-stiffness model.
Remember: Equal sharing needs equal relevant stiffness; it is not automatic.
Trial UC. Data File p.11 gives , , , , , . The original lecture uses the same area . , giving . Both ends are held in position but free to rotate, so , with both axes having .
The source uses rounded , so and prints . Exact interpolation gives ; both pass. The previously omitted major-axis comparison is provided above.
Animation labEffective length and buckling axes
Supplement to the original lesson. Enable JavaScript to play, step through calculations and rotate 3D models. The following explanation remains readable offline.
- A column can bow sideways before its section reaches the crushing resistance.
- Each axis has its own radius of gyration and restraint spacing.
- , with compatible length units. A tie affects only the directions it actually restrains.
- Select each buckling curve and compressive strength before forming Pc. The governing axis is determined by resistance, not slenderness alone.
5. Select and check the lower column
Simple explanation: The column needs more than one pass
A slice can be strong while the whole member still buckles.
- Check cross-section compression plus bending.
- Then check the separate member-buckling expressions.
- Keep each moment, factor and resistance in its specified expression.
Remember: The three checks do not share interchangeable denominators.
Trial UC. Data File p.11 gives , , , , , . The flange thickness again gives . The base is fixed; the floor end is held in position but free to rotate, so use the recommended factor .
The source rounds to , giving (printed ). Exact interpolation gives . Both selected columns pass the requested axial-only design; the lower weak-axis check is more highly utilised.
Animation labEffective length and buckling axes
Supplement to the original lesson. Enable JavaScript to play, step through calculations and rotate 3D models. The following explanation remains readable offline.
- A column can bow sideways before its section reaches the crushing resistance.
- Each axis has its own radius of gyration and restraint spacing.
- , with compatible length units. A tie affects only the directions it actually restrains.
- Select each buckling curve and compressive strength before forming Pc. The governing axis is determined by resistance, not slenderness alone.
Compact exam answer
. Roof / is /; lower-storey accumulation /. Upper-storey ultimate force ; lower-storey imposed load after reduction gives . Upper-storey UC: non-slender, , . Lower-storey UC: non-slender, , . Both are S355 with , governed by minor-axis curve c; both are adequate.
Mistakes to avoid
- Do not use or elevation heights when calculating tributary plan area.
- Include roof load in the lower segment.
- Reduce only imposed load and count the roof as instructed.
- Do not add self-weight twice.
- Use fixed/pinned recommended for the lower column, not the upper one.
Procedure for an unfamiliar variant
- Trace the loads above each column segment and keep dead/imposed components separate.
- Read actual storey heights, section properties and end restraints in both axes.
- For simple construction derive nominal eccentric moments and share them by .
- Classify the section and form the correct section and member resistances.
- Apply only the prescribed load reductions and moment amplification rules.
- Check every storey segment and report both the governing check and source assumptions.
Independent self-check
Try it yourself. Invented variant: imposed-load reduction is explicitly prohibited. Does the selected lower column still pass?
Reveal answer and reasoning
Lower force becomes . Compare with : utilisation, so it still passes. The roof segment is unchanged because it already had zero reduction.
Animation labEffective length and buckling axes
Supplement to the original lesson. Enable JavaScript to play, step through calculations and rotate 3D models. The following explanation remains readable offline.
- A column can bow sideways before its section reaches the crushing resistance.
- Each axis has its own radius of gyration and restraint spacing.
- , with compatible length units. A tie affects only the directions it actually restrains.
- Select each buckling curve and compressive strength before forming Pc. The governing axis is determined by resistance, not slenderness alone.
Animation labEccentric reactions and stiffness sharing
Supplement to the original lesson. Enable JavaScript to play, step through calculations and rotate 3D models. The following explanation remains readable offline.
- A beam reaction can act away from the column centre even at a nominally pinned beam connection.
- . Opposing reactions can cancel part of the signed moment, while both still add compression.
- The course simple model distributes the joint moment in proportion to of the columns above and below.
- Equal relevant stiffness gives half each. A roof joint with no upper column is a different case.
9. The full column procedure Always examined
- Identify: simple or continuous construction? Sway or not? The effective lengths for both axes, the section and the grade.
- Collect the design axial force at each level; work out the eccentric moments or read the given end moments.
- Read the section properties, choose from the thickness, then classify.
- Work out (with the 1.2pZ cap) and check the cross-section formula.
- Work out , choose the curves, interpolate and get .
- Continuous: read (Table 8.9) and (Table 8.4); simple: all three equal 1.
- Formula 1: amplified moments with elastic denominators .
- Work out (continuous: ; simple: ), read , get and use formula 2.
- State the result of each formula and whether all are ≤ 1.
Understanding map: Columns: which number goes into which of the three formulas?
Understanding map
Columns: which number goes into which of the three formulas?
The column question always follows the same steps; the only difficulty is which number goes where, because the section formula and the two buckling formulas use different denominators. Tap any box to see which formula it ends up in. The values are from 2024 BQ3 (254×254×89 UC).
- From the question
- From the tables
- Worked out
- Demand
- Capacity
- Check
- marks are often lost here
Text version (in working order)
From the questionWhere marks are lost
Effective length
Given in the question (same for both axes). Used for the slenderness about each axis.
Needs (upstream)— (a starting value)
Used for (downstream), Slenderness, both axes
From the tables
, Radii of gyration
One for each axis (cm), giving two slendernesses. The minor-axis is much smaller.
Where it comes from: Section table (cm; ×10 for mm).
Needs (upstream)— (a starting value)
Used for (downstream), Slenderness, both axes
From the question
, End moments
The top and bottom moments about both axes, clockwise positive. They give the maximum moment and the sign of .
2024 BQ3
Needs (upstream)— (a starting value)
Used for (downstream), Amplified moments, End-moment ratios Formula 2: compression + LTB
From the tablesWhere marks are lost
Design strength
The flange is mm, thicker than 16 mm, so S355 gives 345. Nearly every capacity box uses it.
Where it comes from: from the section table (Data File p.11) → design-strength table.
Needs (upstream)— (a starting value)
Used for (downstream) (a) Section class Squash load, Section moment capacities, Compression resistance, Elastic moment capacities Buckling resistance moment
From the tables
, Buckling parameter, torsional index
Used only for the LTB , exactly as in the beam LTB question.
Where it comes from: Same section-table row.
Needs (upstream)— (a starting value)
Used for (downstream) Equivalent slenderness
Worked out
, Slenderness, both axes
Work out both. The minor-axis is usually larger, and it is also the for LTB.
Formula
2024 BQ3
Needs (upstream) Effective length, Radii of gyration
Used for (downstream), Compression resistance Equivalent slenderness
From the question
Amplification factor
Compression makes the column bend more, so the moments grow (P–δ). Amplify and once only.
Needs (upstream)— (a starting value)
Used for (downstream), Amplified moments
From the tables
Area
The area of the whole section. Used in and .
Where it comes from: Section table.
Needs (upstream)— (a starting value)
Used for (downstream) Squash load, Compression resistance
From the tables
, Elastic and plastic moduli
is the elastic and the plastic modulus (cm³), one pair per axis. The formulas use them differently: the section formula , the buckling formulas , and uses .
2024 BQ3
Needs (upstream)— (a starting value)
Used for (downstream), Section moment capacities, Elastic moment capacities Buckling resistance moment
Worked out
(a) Section class
. Flange and web → Class 1, so the plastic modulus may be used.
2024 BQ3
Needs (upstream) Design strength
Used for (downstream), Section moment capacities
Worked outWhere marks are lost
, End-moment ratios
Smaller end moment ÷ larger end moment. Single curvature (bending to one side) is positive; double curvature (S-shape) is negative.
2024 BQ3
Needs (upstream), End moments
Used for (downstream), , Moment factors
Worked out
Equivalent slenderness
As for beams: , from , .
Formula
2024 BQ3
Needs (upstream), Slenderness, both axes, Buckling parameter, torsional index
Used for (downstream) Buckling resistance moment
From the question
Design compression
The axial compression the column must carry (kN, factored). All three formulas start with it.
Needs (upstream)— (a starting value)
Used for (downstream) Cross-section capacity Formula 1: compression buckling Formula 2: compression + LTB
From the questionWhere marks are lost
Given M_LT
A separately given moment that is already amplified; used only in formula 2.
Needs (upstream)— (a starting value)
Used for (downstream) Formula 2: compression + LTB
Demand
, Amplified moments
The larger end moment on each axis times the factor. Used in the section formula and formula 1.
Formula
2024 BQ3
Needs (upstream), End moments Amplification factor
Used for (downstream) Cross-section capacity Formula 1: compression buckling
CapacityWhere marks are lost
Squash load
The force that yields the whole section; used only in the section formula.
Formula
2024 BQ3
Needs (upstream) Area Design strength
Used for (downstream) Cross-section capacity
CapacityWhere marks are lost
, Section moment capacities
Class 1 → may be used, capped at . Used only in the section formula.
Formula
2024 BQ3
Needs (upstream) Design strength, Elastic and plastic moduli (a) Section class
Used for (downstream) Cross-section capacity
CapacityWhere marks are lost
, Compression resistance
Interpolate in Table 8.8 with , using the right curve and column, then multiply by the area. UC: curve b about , curve c about .
Formula
2024 BQ3
Needs (upstream), Slenderness, both axes Design strength Area
Used for (downstream) Formula 1: compression buckling Formula 2: compression + LTB
Worked out
, , Moment factors
from Table 8.9; from Table 8.4a (with ), not below 0.44.
Formula
2024 BQ3
Needs (upstream), End-moment ratios
Used for (downstream) Formula 1: compression buckling Formula 2: compression + LTB
CapacityWhere marks are lost
, Elastic moment capacities
The buckling formulas use the elastic as the denominator, even for a Class 1 section.
2024 BQ3
Needs (upstream) Design strength, Elastic and plastic moduli
Used for (downstream) Formula 1: compression buckling Formula 2: compression + LTB
Capacity
Buckling resistance moment
Interpolate in the column of Table 8.3a and multiply by . Used only in formula 2.
Formula
2024 BQ3
Needs (upstream) Equivalent slenderness Design strength, Elastic and plastic moduli
Used for (downstream) Formula 2: compression + LTB
Check
Cross-section capacity
Is one “slice” strong enough? Three fractions added together must be ≤ 1.
Formula
2024 BQ3
Needs (upstream) Design compression Squash load, Amplified moments, Section moment capacities
Used for (downstream)— (the final conclusion)
Check
Formula 1: compression buckling
Will the whole column buckle in compression? Use the smaller of the two axes.
Formula
2024 BQ3
Needs (upstream) Design compression, Compression resistance, , Moment factors, Amplified moments, Elastic moment capacities
Used for (downstream)— (the final conclusion)
CheckWhere marks are lost
Formula 2: compression + LTB
The first term uses the minor-axis ; the middle term the given ; the last term the unamplified (65).
Formula
2024 BQ3
Needs (upstream) Design compression, Compression resistance, , Moment factors Given M_LT Buckling resistance moment, End moments, Elastic moment capacities
Used for (downstream)— (the final conclusion)
Tour steps
1. Collect the ingredients
Copy from the UC row on Data File p.11, and set from .
In this step Design strength Area, Radii of gyration, Elastic and plastic moduli, Buckling parameter, torsional index
2. (a) Classify (4 marks)
comes from ; Class 1 means the section formula may use the plastic modulus .
In this step (a) Section class
3. Amplify the moments (once only)
Take the larger end moment on each axis × 1.1. The separately given is already amplified — do not multiply again.
In this step, End moments Amplification factor, Amplified moments Given M_LT
4. (b) Section check (7 marks)
The denominators are and .
In this step Design compression Squash load, Section moment capacities Cross-section capacity
5. Slenderness and for both axes
; for a UC use curve b about and curve c about , in the 345 column. The minor axis usually governs.
In this step Effective length, Slenderness, both axes, Compression resistance
6. The sign of and the factors
Same sign at both ends → double curvature → negative . The factors follow from .
In this step, End-moment ratios, , Moment factors
7. (c-1) Formula 1
The denominators change to the elastic ; the first term uses the smaller .
In this step, Elastic moment capacities Formula 1: compression buckling
8. (as in the LTB question)
with gives ; look up and multiply by .
In this step Equivalent slenderness Buckling resistance moment
9. (c-2) Formula 2
Seven arrows meet here — watch the three small traps: , the given and the unamplified .
In this step Formula 2: compression + LTB
Animation labEffective length and buckling axes
Supplement to the original lesson. Enable JavaScript to play, step through calculations and rotate 3D models. The following explanation remains readable offline.
- A column can bow sideways before its section reaches the crushing resistance.
- Each axis has its own radius of gyration and restraint spacing.
- , with compatible length units. A tie affects only the directions it actually restrains.
- Select each buckling curve and compressive strength before forming Pc. The governing axis is determined by resistance, not slenderness alone.
Practise this chapter: tutorials, assignments and past-paper answers →
Recent-paper practice for this chapter
- 2024 PTE · Column check
- 2023 FT/PTD · 2023 BQ3 — column with biaxial bending
- 2023 PTE · Column check
- 2022 FT/PTDR · 2022 BQ2 — column with biaxial bending