Foundations: understand the question before using a formula
Start with the question and the member that carries the load.
Learn to trace the load, write equilibrium, choose the relevant failure check, and keep units consistent.
The following sections build the mathematics and mechanics needed for the worked solutions.
1. Units, powers and a calculator
Change the ruler, keep the quantity
A section table uses centimetres, but the strength calculation uses millimetres. The numbers must describe the same section.
Prediction, then explanation. Would every property increase by ten? No. The exponent determines how many factors of ten are needed.
First identify the physical quantity. Next convert each length factor. Keep force and length conversions separate when converting a moment.
Here n is the length exponent: 2 for area, 3 for section modulus and 4 for second moment of area.
Scope. Changing units changes neither the load nor the section. A conversion factor cannot repair a formula for the wrong physical quantity.
Check and takeaway. Illustration: . The fourth power belongs to the unit, not the number 2.
Apply the reasoning to this section’s data and conditions
Physical interpretation: Keep the units on the same scale
Changing units is like changing the ruler, not the object.
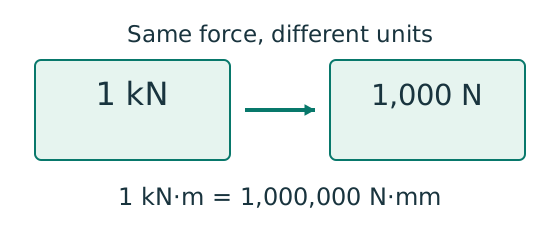
Sketch, not to scale; use the original dimensions.
- ; .
- Area needs two length conversions; inertia needs four.
- Convert before substituting, then check the final unit.
Remember: A kN·m moment becomes 1,000,000 N·mm, not 1,000.
Force describes a push or pull on a body.
Its unit is the newton ().
A kilonewton is .
A bending moment is force × perpendicular distance.
Therefore, its unit is or .
Stress is force divided by area: , also called .
A section property describes geometry.
Its unit must match the property used by the equation.
| Quantity | Conversion | Why the power matters |
|---|---|---|
| Length | ; | Convert length before squaring or cubing. |
| Area | 。 | |
| Section modulus | Used in moment capacity or . | |
| Second moment of area | Used in and deflection. | |
| Moment | 。 | |
| Line load | Both numerator and denominator divide by . | |
| Area load | Width converts a floor load into a beam load. |
Work with and for beam reactions and moments.
Switch to and for stress, strength and deflection, because and are quoted in .
Write the conversion on the same line as the substitution.
On a calculator, brackets keep the whole denominator inside the square root: enter the equivalent of , not .
A fourth root can be entered as a power of .
To calculate , square the ratio first, evaluate the square bracket, take the fourth root, then take the reciprocal.
Retain at least four significant figures before the final comparison.
Prediction and explained answer.
Convert and into mm units.
Answer and reasoning
。。
Mechanism detailsUnits and powers
The complete mechanism is explained below.
Read each stage together with its stated conditions; playback and interaction are not required.
- Force, length and stress must use compatible units before substitution.
.
An area has two length factors, so .
A section modulus has ; second moment of area has .
Use and for cm to mm.
.
Divide by to express that moment in .
Mechanism detailsUnits and powers
The complete mechanism is explained below.
Read each stage together with its stated conditions; playback and interaction are not required.
- Force, length and stress must use compatible units before substitution.
.
An area has two length factors, so .
A section modulus has ; second moment of area has .
Use and for cm to mm.
.
Divide by to express that moment in .
2. Rearrangement and interpolation
Find the missing factor
A resistance is strength multiplied by effective area. Find the area needed for a stated force.
Prediction, then explanation. At fixed strength, doubling the force requires twice the area. The equation should preserve that relationship.
Divide both sides by the same positive strength. This removes strength from the area side without changing the equality.
P is force in N; p is the applicable design strength in N/mm²; A is area in mm².
Scope. The area must match the failure model. Gross area, net area and effective throat area are different quantities.
Check and takeaway. Illustration: . Multiplying 400 by 250 returns 100,000 N.
Move between two known values
The required slenderness lies between two table rows. Estimate the strength on the straight segment between those rows.
Prediction, then explanation. If the second strength is lower, moving toward that row must reduce the interpolated strength.
Subtract the lower input to find distance travelled. Divide by the input interval. Multiply that fraction by the output change.
x is the required input. The two known pairs are (x₀, y₀) and (x₁, y₁). f has no unit.
Scope. Use one table, curve and strength column. This interpolation does not permit extrapolation or inventing an intermediate steel section.
Check and takeaway. Illustration: between strengths 200 and 180, a fraction of 0.4 gives 192 N/mm². The result lies between both endpoints.
Apply the reasoning to this section’s data and conditions
Physical interpretation: A value between two table rows
Move the same fraction of the way across both number ranges.
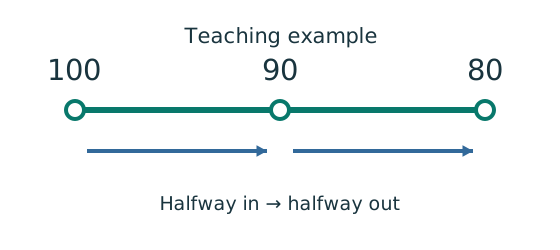
Sketch, not to scale; use the original dimensions.
- Choose the correct table, curve and strength column first.
- Find how far your input lies between the two rows.
- Apply that fraction to the change between their answers.
Remember: Teaching example: halfway between outputs 100 and 80 gives 90.
An equation states that two quantities are equal.
Apply the same operation to both sides to preserve the equality.
To find required area from , divide both sides by : .
Capacity and demand must use the same force unit.
To select a number of bolts, calculate n ≥ P/(capacity of one bolt) and round up to a whole number.
To check an existing design, do not round a failed ratio down to .
A utilisation of exceeds the limit even if a two-decimal display looks close.
Interpolation estimates a value between two table points.
The estimate assumes a straight line between those points.
First select the applicable steel-grade column and buckling curve.
First select those correctly.
Let fall between and with tabulated values and .
The fraction of the interval is .
Invented arithmetic demonstration: if a table gives strength at slenderness 70 and at 80, then at 74, and strength = .
This is an explanation of interpolation, not a course-code lookup.
Prediction and explained answer.
Using that invented table, find the value at .
Answer and reasoning
; strength .
It lies between and .
Mechanism detailsInterpolate between two table rows
The complete mechanism is explained below.
Read each stage together with its stated conditions; playback and interaction are not required.
- Select the correct curve, grade and strength column before choosing the two bracketing rows.
.
The marked position represents the input between the two endpoints.
Its fraction of the full interval determines the interpolated change.
.
A decreasing table needs a negative change in y.
The example uses illustrative outputs 100 and 80.
At the result is 90.
Do not extrapolate missing rows.
Mechanism detailsRearrange a capacity equation
The complete mechanism is explained below.
Read each stage together with its stated conditions; playback and interaction are not required.
For , P is force, p is stress and A is area.
Here we want A.
- Divide both sides by the same non-zero stress p.
- The p on the right cancels, leaving .
gives .
This is required area, not a selected section or a complete design check.
3. Read a structure as a load path
Follow one strip of floor
An area load must become a beam load before beam reactions can be calculated.
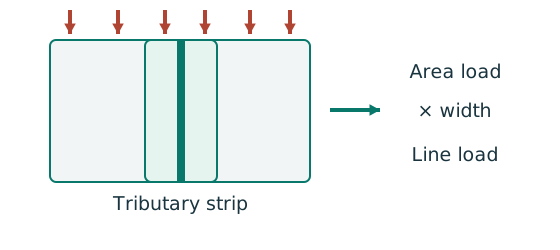
Prediction, then explanation. At fixed area load, twice the tributary width gives twice the line load. An end reaction remains a concentrated force.
Consider one metre along the beam. The associated floor area is b square metres. Multiply area load by that width.
q is area load in kN/m²; b is tributary width in m; w is line load in kN/m.
Scope. Determine b from slab spanning and supports. Add beam self-weight separately. A secondary-beam reaction is not automatically a UDL.
Check and takeaway. Illustration: . The width cancels one length unit.
Balance the isolated beam
Find the two vertical reactions before calculating internal shear or moment.
Prediction, then explanation. Move the same load toward B. Reaction B increases because the load has a larger moment arm about A.
Take moments about A. Reaction A has zero lever arm there. Then use vertical force balance to find reaction A.
P, RA and RB are forces in kN. L is support spacing and a is load position, both in m.
Scope. These expressions describe one point load on a simply supported beam. Add other loads through equilibrium; keep their actual positions.
Check and takeaway. Illustration: P = 60 kN, L = 6 m and a = 2 m give RB = 20 kN and RA = 40 kN.
Apply the reasoning to this section’s data and conditions
Physical interpretation: Why reactions balance the loads
Think of a seesaw that must neither fall nor turn.
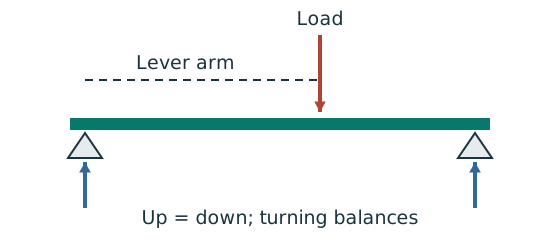
Sketch, not to scale; use the original dimensions.
- Upward and downward forces must balance.
- Take moments about a support to eliminate its reaction.
- Use perpendicular distance from the point to the force line.
Remember: A lateral restraint is not automatically a vertical support.
A floor slab carries an area load.
It passes reactions to secondary beams; secondary beams pass reactions to primary beams; primary beams pass reactions to columns; columns pass compression to foundations.
A support pushes upward on the beam.
The beam applies an equal downward force to that support.
Draw each force on the body that receives it.
Putting both arrows on one isolated member double-counts the connection force.
A free-body diagram isolates one member and replaces its surroundings with support reactions.
A pin resists translation but permits rotation.
A roller allows movement along its supporting surface and supplies one reaction normal to that surface.
A fixed support restrains rotation and can supply a moment.
A lateral restraint stops sideways flange movement.
Include a vertical support only if the actual detail supplies one.
For the course simply supported beam, the pin and roller at the ends support vertical loads.
For a symmetric load arrangement, symmetry gives equal vertical reactions.
Otherwise use the two equilibrium equations below.
Take anticlockwise moments as positive for this derivation.
A different consistent convention gives the same physical answers.
Here is support spacing ().
is a point load ().
is its distance from A ().
is a uniform line load () over the full span.
For overall equilibrium, replace the UDL by its total acting at the centre of the loaded length.
Keep the distribution when finding shear or moment along the member.
A tributary width is the strip of slab whose load reaches a beam.
For a one-way slab with equal beam spacing , an interior beam takes from each side, total .
An edge beam usually takes from one side.
Verify the slab span arrows and supports.
Do not take a span dimension as a tributary width just because it is the nearest printed number.
Prediction and explained answer.
Invented beam: ; a load at from A; over the full span.
Find reactions.
Hint
Take moments about A so its unknown reaction has zero lever arm.
Answer and reasoning
.
.
The two reactions sum to , equal to total downward load.
Mechanism detailsBalance reactions and moments
The complete mechanism is explained below.
Read each stage together with its stated conditions; playback and interaction are not required.
This demonstrator is a simply supported 6 m beam with a 60 kN point load.
It is not the page’s original loading diagram.
.
Moving the load towards B increases .
.
The two upward reactions must sum to P.
With the load at midspan, .
End couples, UDLs and overhangs require their own equilibrium terms.
Mechanism detailsFollow the floor load in 3D
The complete mechanism is explained below.
Read each stage together with its stated conditions; playback and interaction are not required.
The floor carries pressure in .
The highlighted strip belongs to one secondary beam.
Multiply pressure by tributary width: .
The illustration uses .
- A primary beam receives the secondary beam reaction at their connection, not a new full-span UDL.
Trace reactions down to columns and foundations.
Count each loaded area once.
4. Shear force, bending moment and deflection
A cut reveals the internal actions
Find where the beam moment is largest. A large load arrow alone does not locate that point.
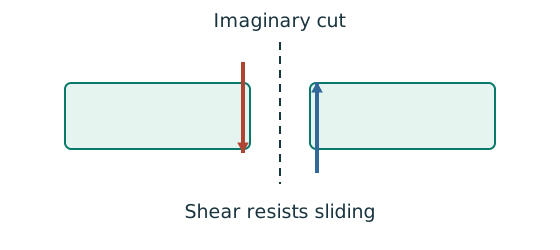
Prediction, then explanation. Under a uniform downward load, shear falls steadily. Moment reaches a stationary value where shear becomes zero.
Balance the forces on the cut piece to get V. Balance their moments about the cut to get M. Evaluate each load region separately.
x and L use m; w uses kN/m; V uses kN; M uses kN·m. These lines apply before any point load.
Scope. A point load adds a shear jump. A concentrated couple adds a moment jump. Check load points, supports and overhang roots too.
Check and takeaway. A UDL gives a sloping shear line and a curved moment line. A flat moment diagram therefore cannot represent a loaded UDL region.
Internal tension and compression resist moment
Find which section resistance applies before comparing it with the moment demand.
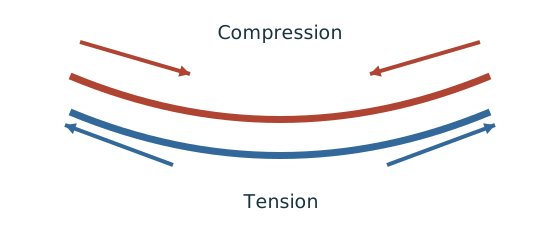
Prediction, then explanation. A larger appropriate section modulus raises resistance at fixed strength. Local plate buckling can restrict the usable modulus.
Classify the section first. At low shear, use the elastic expression for Class 3 or the prescribed capped plastic expression for Classes 1 and 2.
py uses N/mm². S is plastic modulus and Z is elastic modulus, both in mm³. Mc then uses N·mm.
Scope. This is section resistance, not whole-member LTB resistance. High shear and Class 4 require their appropriate treatment.
Check and takeaway. Selecting the larger of the two capped terms defeats the cap. Use their minimum.
A safe beam can still sag too far
Check whether the beam displacement exceeds the permitted service limit.
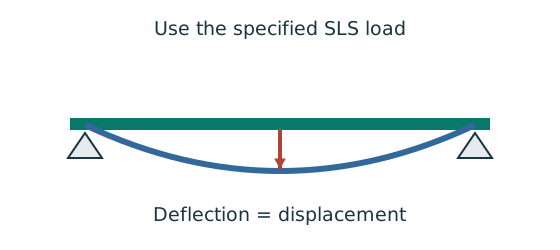
Prediction, then explanation. For the same UDL and stiffness, doubling span multiplies deflection by sixteen. Doubling I halves deflection.
Load bends each beam segment. The curvature accumulates along the span. Material stiffness E and geometric stiffness I resist that deformation.
Use w in N/mm, L in mm, E in N/mm² and I in mm⁴. The resulting midspan deflection is in mm.
Scope. The formula assumes a prismatic, simply supported, linear-elastic beam with full-span UDL. Use the stated service load and deflection limit.
Check and takeaway. A higher yield grade does not automatically increase E. Passing a strength check therefore does not prove acceptable deflection.
Apply the reasoning to this section’s data and conditions
Physical interpretation: What shear is trying to do
Imagine cutting the beam: shear stops the two cut faces sliding past each other.
Sketch, not to scale; use the original dimensions.
- Find the design shear from the load analysis.
- Use the section’s applicable shear area and strength.
- Compare demand with resistance in the same force units.
Remember: The web usually carries much of the vertical shear in an I-section.
Shear is the internal transverse force needed to keep either part of a cut beam in equilibrium.
Bending moment is the internal turning effect at that cut.
Deflection is the displacement of the beam from its unloaded position.
Demand is the effect of the applied load.
Resistance is the permitted capacity for the failure mode being checked.
Under a UDL the shear diagram is a straight sloping line and the moment diagram is a parabola.
A point load causes a vertical jump in shear, while moment stays continuous.
An applied couple causes a jump in the moment diagram.
Between point loads the maximum or minimum moment occurs where ; also check supports, load points and overhang roots.
The largest moment may occur away from a point load.
Check the shear-zero positions and region boundaries.
These shortcuts assume a simply supported beam and the stated load position.
For an off-centre point load or an overhang, start with equilibrium.
Under linear elastic behaviour, results of separate load cases can be added at the same position (superposition).
Adding maxima at different positions is not generally an exact maximum.
For a prismatic simply supported beam with constant and :
is the course Young’s modulus: material stiffness.
is the second moment of area about the bending axis in : geometric stiffness.
Use unfactored imposed load for the course’s usual beam deflection checks.
A load factor increases design demand for ULS.
It does not increase the physical stiffness .
Prediction and explained answer.
A simply supported beam has and .
What are its maximum shear and moment?
Answer and reasoning
.
.
The moment has one extra length factor, so it cannot have units .
Mechanism detailsBalance reactions and moments
The complete mechanism is explained below.
Read each stage together with its stated conditions; playback and interaction are not required.
This demonstrator is a simply supported 6 m beam with a 60 kN point load.
It is not the page’s original loading diagram.
.
Moving the load towards B increases .
.
The two upward reactions must sum to P.
With the load at midspan, .
End couples, UDLs and overhangs require their own equilibrium terms.
Mechanism detailsBuild the shear and moment diagrams
The complete mechanism is explained below.
Read each stage together with its stated conditions; playback and interaction are not required.
- For the illustrative 60 kN point load on a 6 m simply supported beam, balance the reactions before making a cut.
and before the point load.
Moment grows linearly.
Shear jumps down by P.
To its right, and .
For this case, moment is continuous and returns to zero at B.
A concentrated applied couple instead creates a moment jump.
5. Steel, stiffness, strength and ductility
Separate stiffness, strength and ductility
Two steels may resist similar elastic deformation but start permanent deformation at different stresses.
Prediction, then explanation. Raising the yield level alone need not change the initial slope. The same elastic load can therefore give similar deformation.
Stress is force per area. Strain is extension divided by original length. Their elastic ratio defines Young’s modulus.
σ is stress in N/mm²; ε is dimensionless strain; E is Young’s modulus in N/mm².
Scope. Use this linear relationship only in its elastic range. Ductility concerns deformation before fracture, not the value of E.
Check and takeaway. When elastic load is removed, elastic strain recovers. Yielded steel can retain strain after unloading.
Apply the reasoning to this section’s data and conditions
Source: Chapter 1 pp. 2–3; L1 slides 3 and 10.
Steel is mainly iron with small alloying additions.
The course lists iron about , carbon up to , manganese up to , silicon –, and sulphur/phosphorus each up to .
More carbon generally increases strength.
However, more carbon reduces ductility and weldability.
This trade-off explains why structural steel limits its carbon content.
Yield strength is the stress at which significant permanent deformation begins.
Stiffness is resistance to elastic deformation.
A higher steel grade does not by itself give a higher course value of .
Ductility is the ability to deform substantially before fracture.
Weldability is the ability to form satisfactory welded joints using suitable procedures.
A design can be strong enough and still deflect too much.
The course uses S275, S355 and S460 for BS EN steels and describes Q235, Q345, Q390 and Q420 for Chinese-standard steels.
The grade label is not automatically the design strength for every thickness.
Use the relevant material table and thickness interval.
Mechanism detailsElasticity, yielding and ductility
The complete mechanism is explained below.
Read each stage together with its stated conditions; playback and interaction are not required.
Stress is force divided by area.
Strain measures change in length relative to original length.
Before yielding, stress is approximately .
E controls the elastic slope.
Further strain includes permanent deformation.
Higher yield strength does not by itself increase E.
Strength, stiffness and ductility answer different questions.
This schematic is not a measured stress–strain curve.
6. Fatigue under repeated loading
Repeated loading can grow a crack
A detail experiences many load cycles. A single static resistance check does not describe its fatigue behaviour.
Prediction, then explanation. More cycles or a larger stress range can increase fatigue damage. Remaining below yield is not a universal fatigue guarantee.
A local notch or weld detail concentrates stress. Repeated changes can extend a crack from that region.
Δσ is stress range in N/mm². Maximum and minimum stresses must refer to the same location and stress component.
Scope. The sketch is a mechanism explanation, not a life prediction. Fatigue design requires the applicable detail category and load history.
Check and takeaway. A static pass does not remove the need for a fatigue check when repeated loading is relevant.
Apply the reasoning to this section’s data and conditions
Source: Chapter 1 pp. 2 and 14.
Fatigue is progressive crack growth under repeated stress changes.
Typical course examples are crane girders and bridges.
It differs from one excessive static load: many repetitions can grow a crack even when one application appears harmless.
Avoid abrupt changes in section and local stress concentrations in details.
The notes say ordinary wind fluctuations generally do not require fatigue design unless numerous stress fluctuations arise.
Use the question’s stated loading regime.
Exam script: “Fatigue is failure caused by progressive crack growth under fluctuating stress. Avoid abrupt section changes and stress concentrations, and detail welded connections appropriately.”
Mechanism detailsRepeated loading grows a crack
The complete mechanism is explained below.
Read each stage together with its stated conditions; playback and interaction are not required.
- A notch or abrupt detail can concentrate stress near the connection.
- Many load cycles can initiate a crack even when one application does not cause static failure.
The illustrative crack length increases with the animation stages.
It is not a fatigue-life calculation.
Use the specified fatigue method and detail category.
Avoid abrupt changes and identify whether repeated loading is relevant.
7. Corrosion protection
Interrupt the corrosion process
Steel exposed to moisture and oxygen can lose material. Explain what each protection system does.
Prediction, then explanation. If a barrier coating is damaged, the exposed region can corrode. Zinc can also provide sacrificial protection where conditions permit.
Paint works mainly as a barrier. Galvanizing adds a zinc layer with barrier and sacrificial effects. Surface preparation affects performance.
No universal coating thickness or life follows from this mechanism sketch.
Scope. Weathering steel still needs suitable exposure and detailing. A protection label does not replace inspection or maintenance.
Check and takeaway. The useful comparison is the protection mechanism, exposure and maintenance need. Do not describe all coatings as identical barriers.
Apply the reasoning to this section’s data and conditions
Source: Chapter 1 p.2.
Corrosion removes steel and reduces effective section thickness.
Paint and metallic coatings separate the steel from the environment.
Zinc or aluminium coatings improve corrosion/abrasion resistance in the course discussion.
Cathodic protection is described for structures continuously immersed in water.
Weathering steel forms a protective oxide layer because of its alloy composition.
It is a material choice with environmental applicability, not a paint coating.
Exam script for two methods: “Apply a protective paint or zinc coating to isolate the steel from corrosive exposure. For continuously immersed structures, use cathodic protection to reduce electrochemical corrosion.” Give two distinct methods and a short mechanism, rather than two brand names for paint.
Mechanism detailsHow corrosion protection works
The complete mechanism is explained below.
Read each stage together with its stated conditions; playback and interaction are not required.
- Corrosion can consume steel and reduce its effective thickness.
- Paint and metallic coatings protect the exposed surface; coating integrity matters.
Edges, damaged coatings and water-trapping details deserve attention.
The model shows layers schematically.
- Weathering steel and cathodic protection have specific environmental applications; they are not universal substitutes for paint.
8. Fire protection: learn the sketch
Delay heat reaching the steel
Identify how the protection surrounds a steel section. Then explain its purpose in a fire.
Prediction, then explanation. An insulating layer can slow heating. It does not mean the steel remains at room temperature indefinitely.
Heat changes steel behaviour. Protection delays that change by restricting heat transfer. Show the steel and protection boundaries separately.
The labelled boundaries describe geometry. They do not specify a tested fire-resistance rating.
Scope. Required thickness depends on the system, member and required rating. Do not infer thickness or minutes from a schematic.
Check and takeaway. For a sketch answer, distinguish all three shapes and state that protection delays steel heating.
Apply the reasoning to this section’s data and conditions
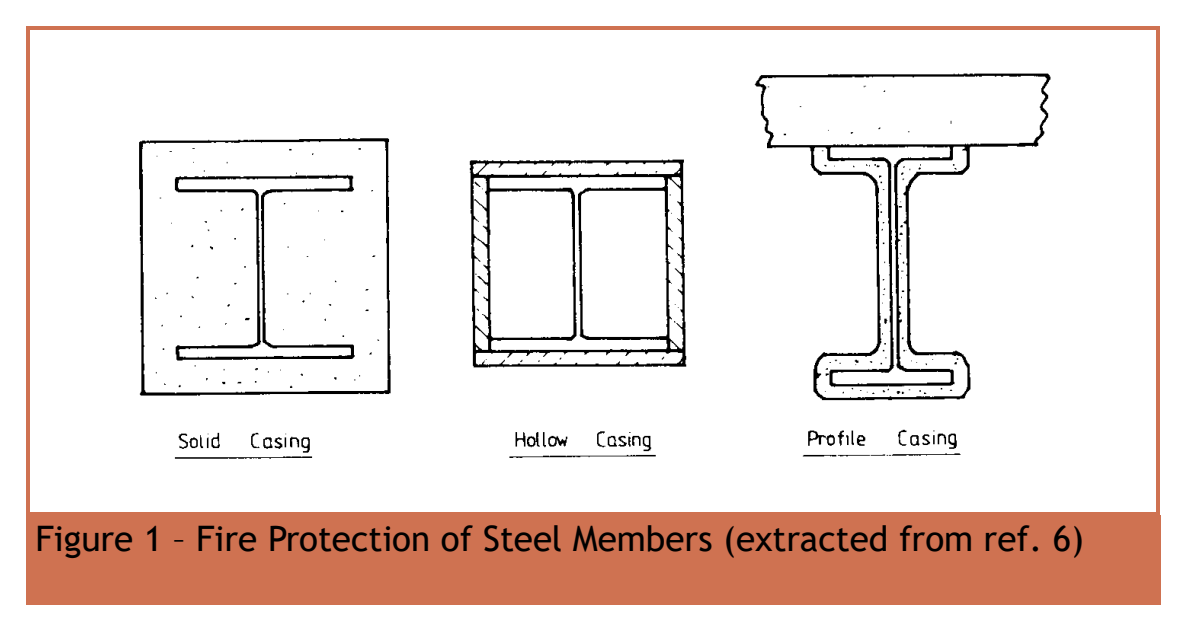
Source: Chapter 1 p.3.
Structural steel loses strength as temperature rises.
Fire protection delays heating of the load-bearing section.
The original sketch compares three protection shapes.
Solid casing fills the rectangle around the I section.
Hollow casing forms a box with an air space.
Profile casing follows the steel outline.
For a two-method sketch, show the I section inside each protection outline.
Label each protection layer.
The supplied figure does not specify a material thickness or resistance period, so do not invent one.
Prediction and explained answer.
Does a hollow fire-protection casing mean the structural steel member itself must be a hollow section?
Answer and reasoning
No. The source figure shows an I section inside a hollow protective enclosure.
Distinguish the steel shape from the protection shape.
Mechanism detailsSee the fire-protection enclosure
The complete mechanism is explained below.
Read each stage together with its stated conditions; playback and interaction are not required.
Steel loses strength as it heats.
Protection aims to delay heat reaching the section.
- Solid casing fills the enclosure around the I-section.
- A hollow enclosure surrounds the section while leaving an air space.
Profile casing follows the section outline.
The supplied sketch does not determine protection thickness or fire duration.
9. Section shapes, axes and the section designation
Use the property for the physical question
A section table contains several numbers. Choose the property that matches the calculation and bending axis.
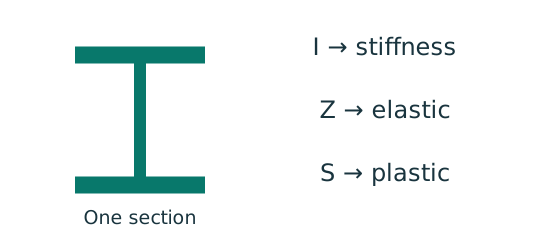
Prediction, then explanation. Moving equal area away from an axis increases I about that axis. It does not increase total area.
Each small area contributes its area multiplied by squared distance. Sum those contributions to obtain I.
I is second moment of area in mm⁴. y is distance from the chosen axis in mm. A is area in mm². r is radius of gyration in mm.
Scope. Z is elastic section modulus; S is plastic section modulus in this course. Neither is interchangeable with I.
Check and takeaway. A nominal section designation is a row identifier. Use the actual dimensions and units in that exact row.
Apply the reasoning to this section’s data and conditions
Physical interpretation: Why I, Z and S are different
The same section has different numbers for different jobs.
Sketch, not to scale; use the original dimensions.
- I describes how area is spread: it affects elastic stiffness.
- Z is the elastic section modulus; S is the plastic section modulus.
- Choose the property, axis and units required by the formula.
Remember: Use the modulus named in the equation.
A larger plastic modulus cannot replace a required elastic modulus.
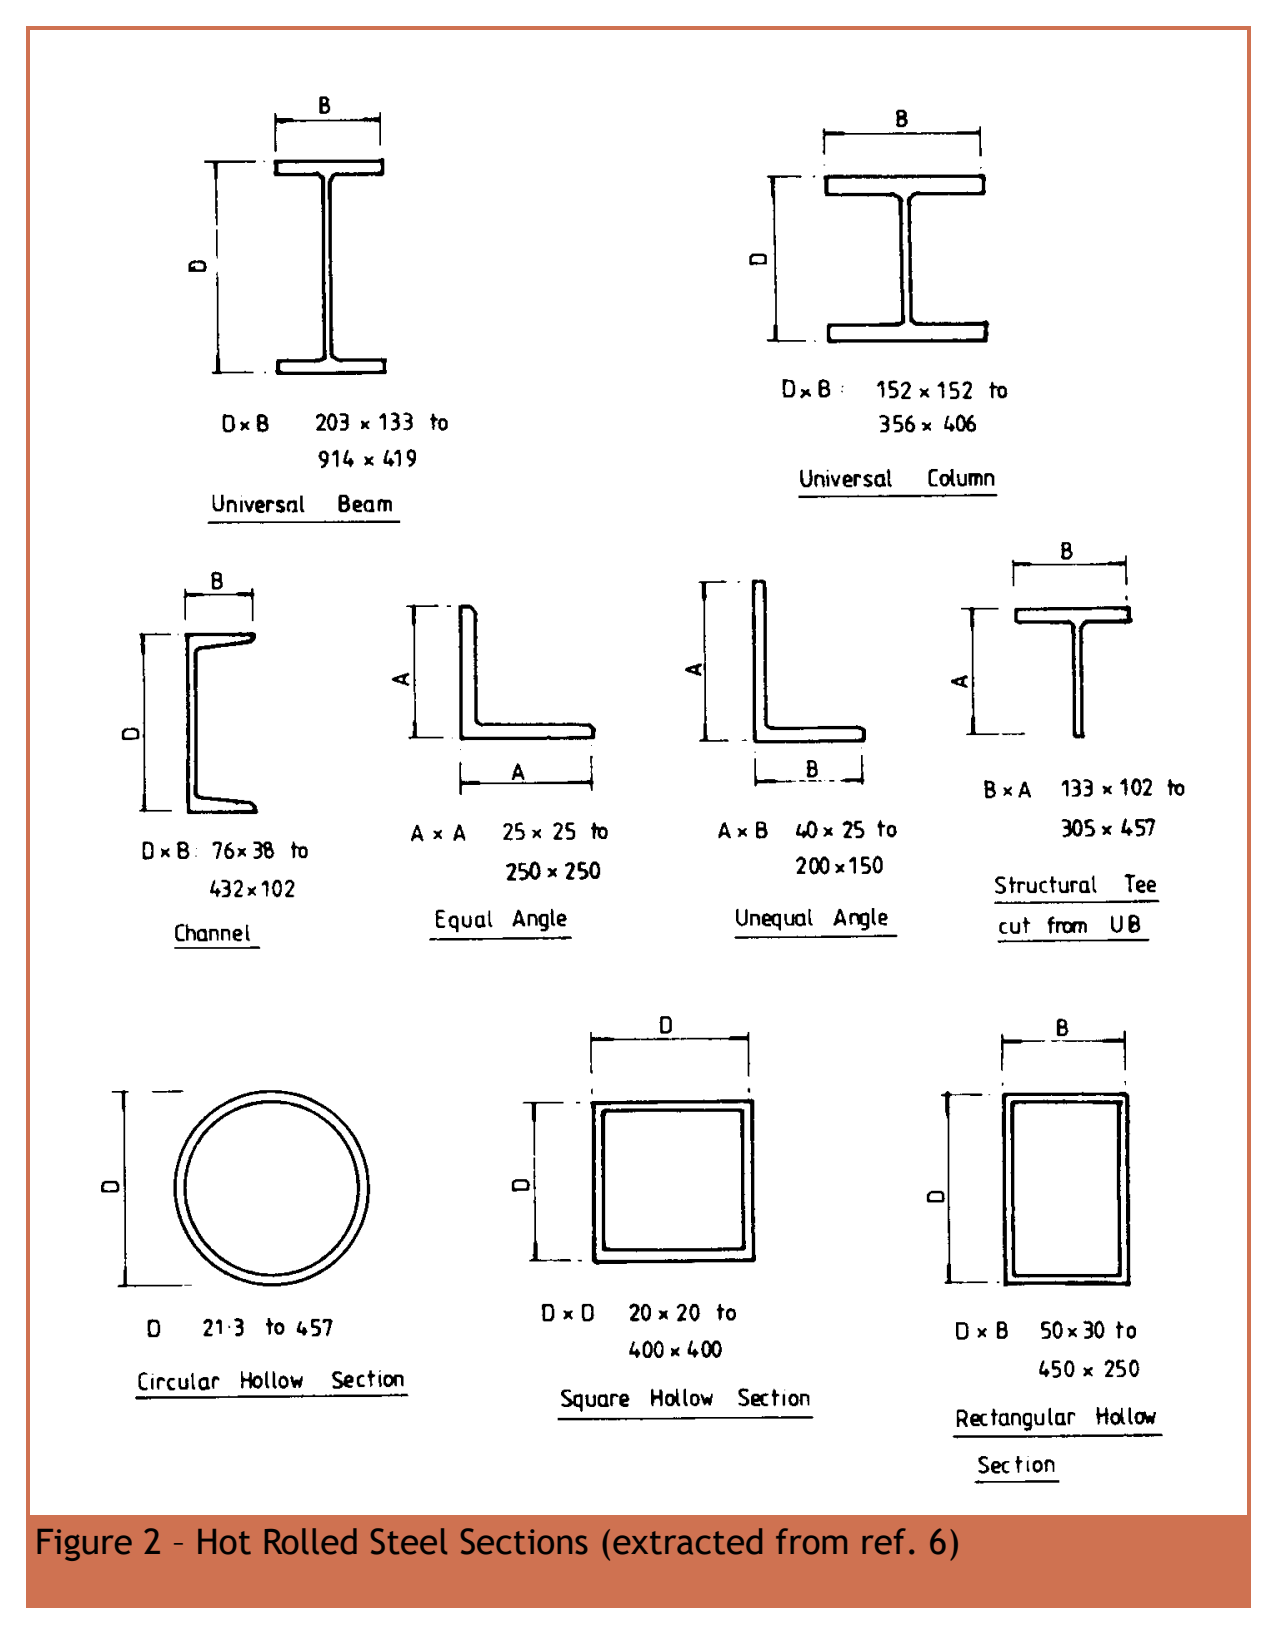
Chapter 1 p.4, Figure 2.
Labels identify UB (universal beam), UC (universal column), channel, equal/unequal angles, tee cut from UB and hollow sections.
Selectable equivalents of the dimension labels follow.
These retain the source ranges, not design inputs for a particular calculation: UB is to ; UC is to ; channel is to ; equal angle is to ; unequal angle is to ; tee is to ; circular hollow section is to ; square hollow section is to ; rectangular hollow section is to .
The individual arrows identify overall depth, overall width or angle-leg length.
Do not measure additional dimensions from drawing scale.Open full-size image
UB means Universal Beam.
Its deeper shape efficiently resists bending about its major axis.
UC means Universal Column.
Its broad flanges suit compression and biaxial resistance.
Channels and angles are common in bracing, trusses and compound members.
A structural tee can be cut from a UB or UC.
CHS, SHS and RHS mean circular, square and rectangular hollow sections.
In these course calculations is the major cross-section axis and is the minor axis.
A designation such as UB gives nominal size and mass per unit length.
It does not say its actual depth is exactly , flange width exactly , or thickness .
Look up the actual dimensions and properties in the row with the complete designation.
With , produces self-weight.
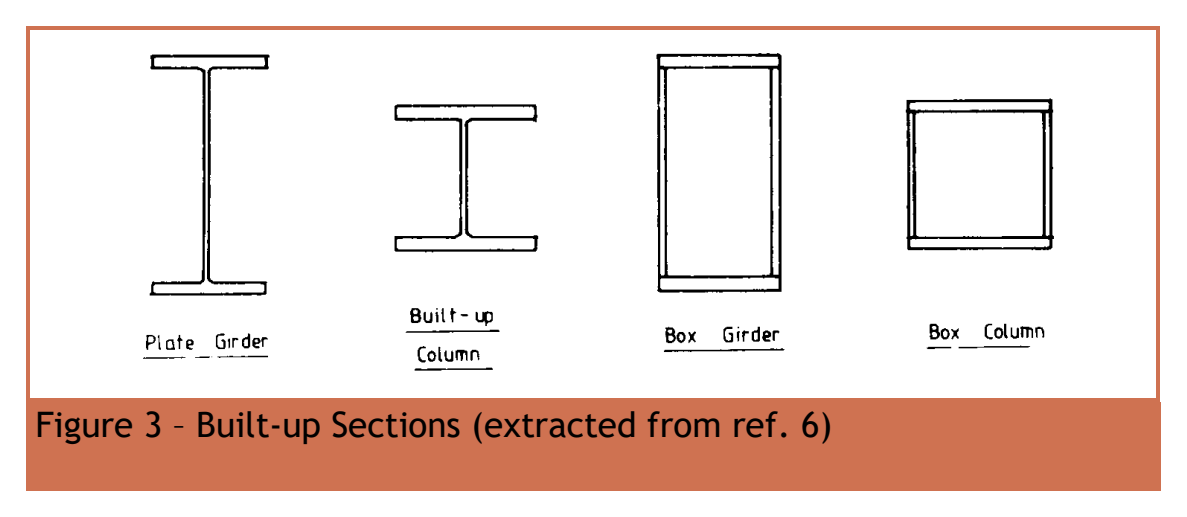
Chapter 1 p.5, Figure 3: separate plates are welded into I-, H- and box sections.
The web connects upper and lower flanges.
A box is assembled from its surrounding plates.Open full-size image
Built-up sections are fabricated from plates welded into an I, H or box.
In a sketch show the separate web/flange plates or box walls and indicate their welded joints.
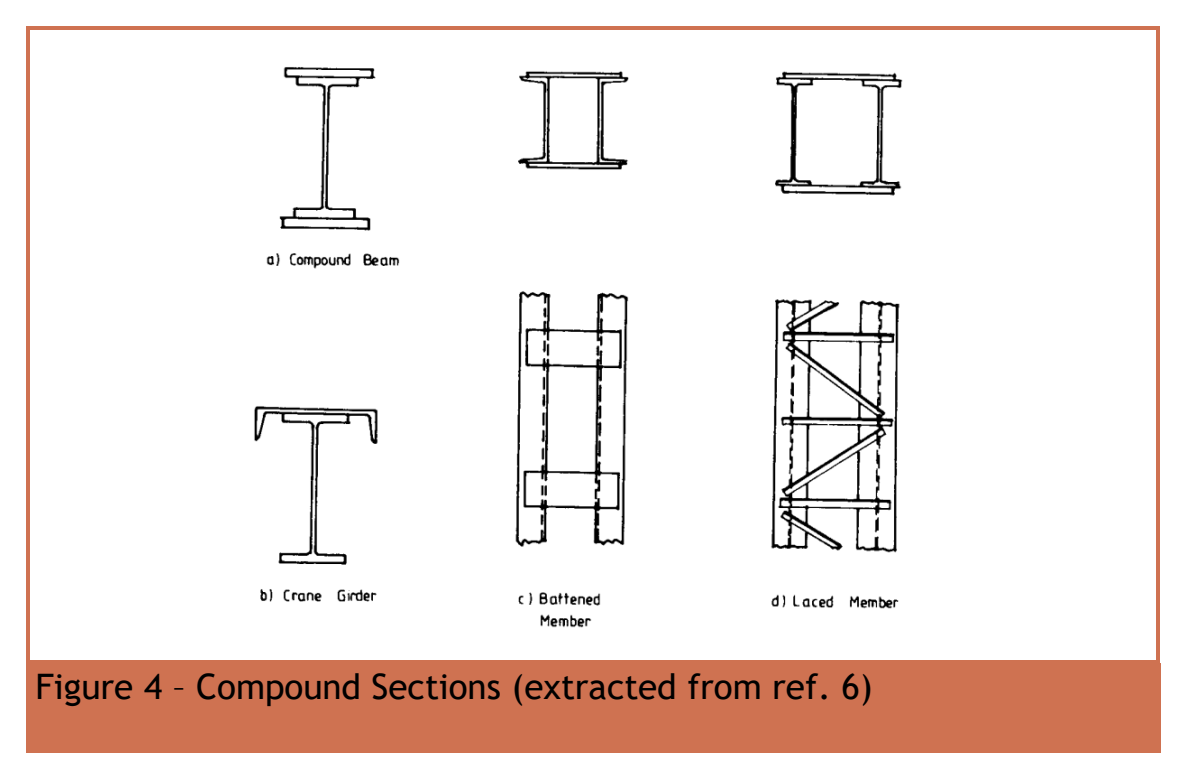
A compound section combines rolled members or adds cover plates.
The original examples include strengthened beams, crane girders, battened and laced columns.
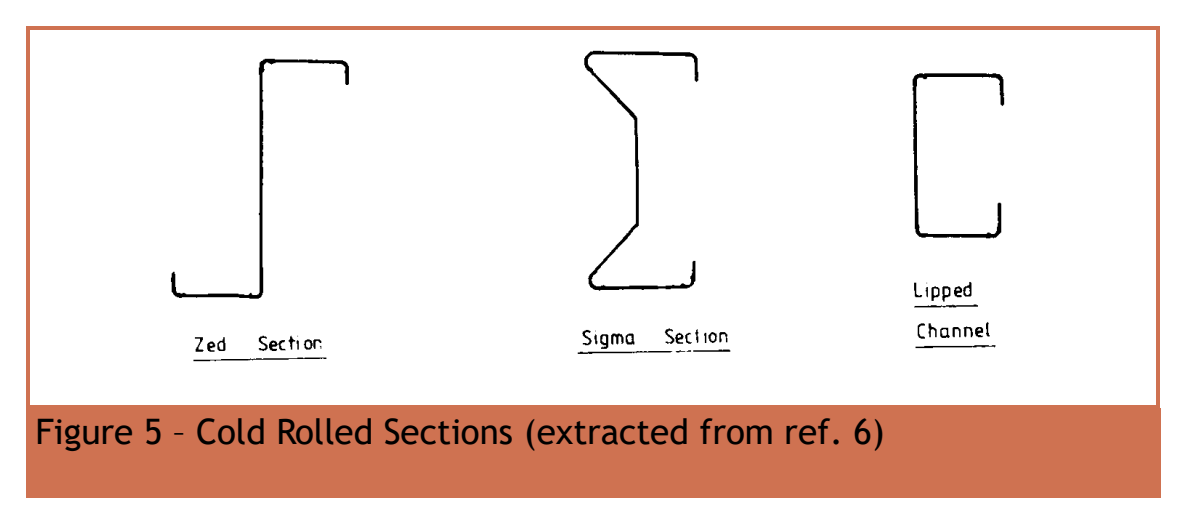
Cold-formed sections are bent from thin sheet, often used as purlins and sheeting rails.
Do not apply the UB section formulas automatically to these thin-walled shapes.
For an exam asking four hot-rolled shapes, use UB, UC, channel and angle, with recognisable labelled cross sections.
Mechanism detailsExplore section geometry and axes
The complete mechanism is explained below.
Read each stage together with its stated conditions; playback and interaction are not required.
The flanges are the wide plates.
The web connects them.
Rotate the I-section to see both.
- The same section has different stiffness and resistance about its two principal axes.
I controls elastic curvature.
is elastic section modulus.
Plastic modulus S comes from plastic stress blocks.
Nominal section labels are not every actual dimension.
Keep the row, axis and units together.
10. ULS and SLS
Ask two separate design questions
Decide whether the check concerns failure or unacceptable behaviour during use.
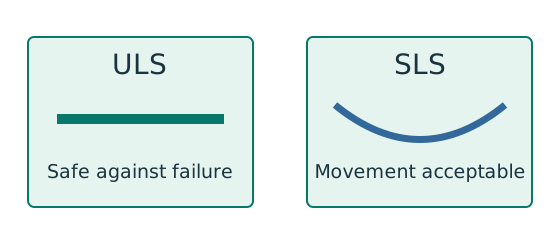
Prediction, then explanation. A larger section may improve both results, but a pass on one branch does not prove a pass on the other.
ULS addresses relevant strength and stability failure modes. SLS addresses specified service conditions such as deflection.
δ is the calculated displacement; δlimit is the permitted displacement. Both must use the same length unit.
Scope. Use each check’s own load combination and limit. A strength load factor does not change the physical stiffness.
Check and takeaway. Write separate conclusions for strength, stability and serviceability where requested. A single unexplained “safe” hides those distinctions.
Apply the reasoning to this section’s data and conditions
Physical interpretation: Strong enough and stiff enough are two questions
A shelf can avoid breaking yet still sag too much.
Sketch, not to scale; use the original dimensions.
- ULS checks safety against the relevant failure modes.
- SLS checks the specified everyday-use limit.
- Use the load case required for each check.
Remember: Check deflection separately after checking bending resistance.
The two checks use different limits.
Source: Chapter 1 p.7, Table 2.1 extract.
A limit state is a condition beyond which a structure no longer meets a requirement.
Ultimate limit state (ULS) concerns collapse or irreparable damage: yielding, rupture, buckling, mechanism formation, overturning, sliding, uplift, fire, brittle fracture and fatigue.
Serviceability limit state (SLS) concerns use: excessive deflection, vibration, wind-induced oscillation and durability.
The design process applies load factors to characteristic loads, calculates their effects, and compares those effects with design resistance.
A higher factor for imposed load reflects greater uncertainty/variation in that action.
Material safety treatment is already embodied in the supplied design-strength values.
Do not add an unrelated Eurocode material factor to these course capacities.
Prediction and explained answer.
A beam has adequate strength but cracks its plaster finish through excessive movement.
Which check has failed?
Answer and reasoning
Serviceability, specifically deflection.
Passing ULS does not establish SLS adequacy.
Mechanism detailsTwo different design questions
The complete mechanism is explained below.
Read each stage together with its stated conditions; playback and interaction are not required.
- ULS compares factored actions with the applicable resistance to yielding, rupture or instability.
- SLS checks movement, vibration or another specified use requirement.
A beam can be strong enough but deflect too much.
The two checks need their own loads and denominators.
A resistance pass cannot stand in for a serviceability pass.
Complete all requested checks.
11. Which loads and factors belong in a calculation?
Keep load categories separate
A floor carries permanent material and changing occupancy loads. Find the design load for the stated check.
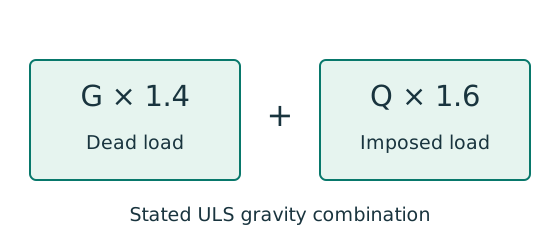
Prediction, then explanation. Increasing imposed load changes its own term. It does not change the dead-load factor or the steel stiffness.
First convert mass to weight where required. Next collect G and Q in compatible units. Apply the combination specified by the course problem.
G is characteristic dead load; Q is characteristic imposed load. Wu is the design load for this course gravity combination.
Scope. This combination is not universal. Use the specified service load for deflection and the stated factors for other standards or cases.
Check and takeaway. Illustration: G = 10 kN and Q = 5 kN give 22 kN. Factoring their sum by one guessed factor loses the distinction.
Use the same mechanism: Follow one strip of floor. At fixed area load, twice the tributary width gives twice the line load. An end reaction remains a concentrated force.
Apply the reasoning to this section’s data and conditions
Physical interpretation: Why dead and imposed loads stay separate
Keep permanent load and imposed load separate until their respective factors have been applied.
Sketch, not to scale; use the original dimensions.
- Include self-weight and permanent finishes in permanent load.
- Include the specified occupancy load in imposed load.
- For this course’s stated gravity combination: .
Remember: That ULS combination is not the imposed-load deflection load.
Source: Chapter 1 pp.8–9 and 13–14; Data File p.1 onward.
is characteristic dead load (permanent self-weight/finishes).
is characteristic imposed load (use/occupancy).
is wind load.
The principal adverse combinations taught are:
These compact forms assume adverse actions in the stated combination.
The original Table 4.2 distinguishes beneficial actions: dead load resisting uplift or overturning uses , and favourable imposed load may be omitted.
Table 4.4 also contains crane, earth/water, temperature, accidental and construction cases.
Read that exact row if one is specified.
Do not extrapolate / to every action.
An ultimate/factored/design load has already been factored.
Do not multiply it by or again.
If a question gives characteristic dead and imposed loads separately, factor them once.
If self-weight is explicitly included, do not add it again.
Otherwise mass per metre × gives a dead line load.
Prediction and explained answer.
Invented slab: concrete at , finishes and imposed load .
Find factored floor intensity.
Answer and reasoning
Concrete: .
Dead total .
.
Mechanism detailsFrom characteristic to design load
The complete mechanism is explained below.
Read each stage together with its stated conditions; playback and interaction are not required.
G is permanent load; Q is imposed load.
A surface load and a line load also have different units.
This illustration uses the course gravity case .
Other combinations in the original text retain their own factors.
- For illustrative , the separate load contributions show what changes when Q increases.
Do not carry this ULS total automatically into deflection.
Follow the stated SLS load case.
Mechanism detailsFrom characteristic to design load
The complete mechanism is explained below.
Read each stage together with its stated conditions; playback and interaction are not required.
G is permanent load; Q is imposed load.
A surface load and a line load also have different units.
This illustration uses the course gravity case .
Other combinations in the original text retain their own factors.
- For illustrative , the separate load contributions show what changes when Q increases.
Do not carry this ULS total automatically into deflection.
Follow the stated SLS load case.
12. Simple, continuous and semi-continuous construction
Restraints define the analysis model
Choose an analysis model that represents the actual joints, restraints and possible sway.
Prediction, then explanation. A joint that permits beam rotation does not automatically remove all column moment. Eccentric reactions may still bend the column.
First identify the joint behaviour. Next identify how horizontal forces reach the foundations. Then assess sway sensitivity using the course criterion.
Simple, continuous and semi-continuous construction describe joint modelling. Sway classification describes overall frame response.
Scope. The schematic does not establish restraint stiffness or a stability threshold. Use the stated data and classification rules.
Check and takeaway. An ideal straight frame may still require notional horizontal forces to represent imperfections under the applicable method.
An eccentric beam reaction bends the column
A simple beam joint delivers a vertical reaction away from the column centre. Find the resulting column moments.
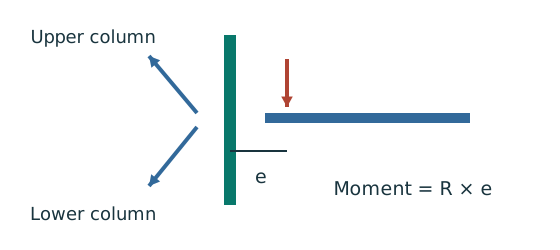
Prediction, then explanation. Equal opposite-face reactions can cancel a joint moment. Their downward forces still add to column compression.
Sum axial forces first. Calculate the signed eccentric moments. Share the net joint moment between upper and lower columns using the stated stiffness model.
R is reaction; e is perpendicular eccentricity. K denotes the stiffness measure prescribed for moment sharing.
Scope. Equal sharing requires equal stated stiffness. Use actual storey length where the special simple-construction LTB rule requires it.
Check and takeaway. A pin-like beam connection can still cause an eccentric reaction moment in the column. Joint rotation and reaction location are separate facts.
Apply the reasoning to this section’s data and conditions
Source: Chapter 1 p.10.
Simple design idealises beam joints as pins, so a beam end does not develop a continuity moment.
A bracing system or rigid core carries lateral actions.
Nominal eccentricity of a vertical beam reaction can still bend the supporting column; “pinned beam connection” does not mean “column has zero moment”.
Continuous design uses connections with sufficient stiffness/strength for the frame analysis and transfers moments through joints.
Semi-continuous design explicitly models intermediate joint stiffness and strength, based on test evidence or calibrated analysis.
It is a stated theory topic here, not a licence to assume an arbitrary amount of fixity.
Mechanism detailsRestraints, sway and imperfections
The complete mechanism is explained below.
Read each stage together with its stated conditions; playback and interaction are not required.
- A frame needs a defined path for horizontal force as well as gravity.
- Pinned joints alone do not provide frame moment resistance; sway restraint needs a real structural system.
Diagonal bracing carries horizontal action through axial forces.
This sketch does not assign a numerical frame classification.
Use the specified imperfection/notional-force model and critical-load criteria.
Avoid counting alternative imperfection models twice.
13. and : why geometry changes force effects
Compression acts on the displaced shape
A compressed member moves away from its initial load line. Explain why the bending moment can increase.
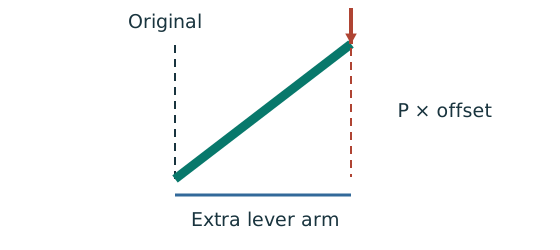
Prediction, then explanation. At fixed axial force, a larger offset creates a larger additional moment. This can further increase the displacement.
Force acting through an offset forms a moment. Second-order analysis includes that changed geometry in equilibrium.
P is axial force. Δ and δ are the relevant perpendicular displacements. Consistent force and length units give moment units.
Scope. Use the amplification or analysis method stated for the frame. Do not amplify an already amplified moment a second time.
Check and takeaway. Zero offset removes this additional moment in the ideal sketch. Real design may still require imperfections and code checks.
Apply the reasoning to this section’s data and conditions
Physical interpretation: Moving sideways gives the load a new lever arm
Once a compressed member moves sideways, the same compression creates extra moment.
Sketch, not to scale; use the original dimensions.
- P–Δ concerns overall frame or storey movement.
- P–δ concerns bowing relative to the member’s end line.
- Amplify only the first-order moments specified by the method.
Remember: Do not amplify a moment that the question already gives as amplified.
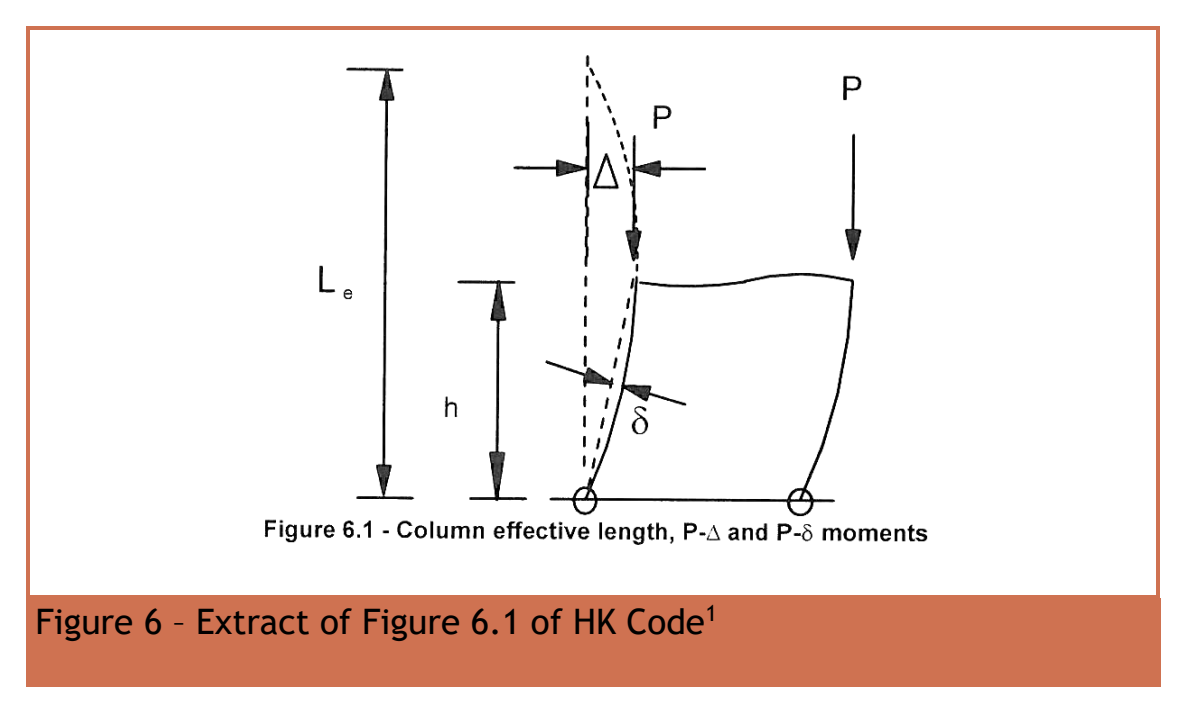
Chapter 1 p.11, Figure 6.
Legend: = global sideways movement; = member bow relative to the line joining its ends.
Other source labels: is downward axial compression.
is the frame height shown.
is column effective length.
The source lower-case subscript is retained.
The diagram title concerns column effective length and and moments (Column effective length, and moments) .
First-order analysis calculates equilibrium on the original undeformed geometry.
If axial compression acts through a displaced point, it creates an extra moment: .
is associated with frame sway/global displacement; with local member curvature.
Identify which deformation appears in a sketch before naming the effect.
Second-order -only analysis considers the displaced frame but leaves local member bowing to be allowed for separately.
Second-order analysis includes frame deformation, member bowing/stiffness change and imperfections.
Advanced analysis also includes material yielding.
The notes permit first-order results with the specified effective-length and moment-amplification checks.
If a stated moment already includes amplification, do not amplify it again.
Exam script: “The analysis establishes equilibrium in the deformed position, including additional moments from axial forces acting through frame sway and member bow . Frame/member imperfections and stiffness changes are included in the second-order model.”
Mechanism detailsSeparate P–Δ from P–δ
The complete mechanism is explained below.
Read each stage together with its stated conditions; playback and interaction are not required.
- The dashed line marks the original frame position; axial compression acts downwards.
- Global displacement Δ creates the additional moment PΔ.
- Local displacement δ is measured from the line joining the displaced ends, and adds Pδ.
Follow the original analysis route.
Do not amplify an already amplified moment or confuse critical-load factor with member slenderness.
14. Imperfections and notional horizontal force
Use the same mechanism: Restraints define the analysis model. A joint that permits beam rotation does not automatically remove all column moment. Eccentric reactions may still bend the column.
Use the same mechanism: Compression acts on the displaced shape. At fixed axial force, a larger offset creates a larger additional moment. This can further increase the displacement.
Apply the reasoning to this section’s data and conditions
Source: Chapter 1 pp.12–13 and L1 slide 8.
Real frames are not perfectly plumb and members are not perfectly straight.
The course equivalent global geometric imperfection is .
An alternative uses a notional horizontal force equal to of the relevant factored vertical loading.
These represent an imperfection model, not a new gravity load.
The initial member bow depends on its buckling curve: the Table 6.1 extract lists , , , and for curves , , , and respectively.
Use the applicable method.
The effective-length and moment-amplification method already represents relevant imperfections.
Before adding separate bow moment, check what the analysis model already includes.
Mechanism detailsRestraints, sway and imperfections
The complete mechanism is explained below.
Read each stage together with its stated conditions; playback and interaction are not required.
- A frame needs a defined path for horizontal force as well as gravity.
- Pinned joints alone do not provide frame moment resistance; sway restraint needs a real structural system.
Diagonal bracing carries horizontal action through axial forces.
This sketch does not assign a numerical frame classification.
Use the specified imperfection/notional-force model and critical-load criteria.
Avoid counting alternative imperfection models twice.
15. Strength, overall stability and robustness
Keep a local failure from spreading
Explain why adequate strength of each isolated member does not by itself establish structural robustness.
Prediction, then explanation. If no viable alternative route exists, a local loss can affect a much larger part of the structure.
Robustness concerns the consequences of damage. Ties, continuity and alternative paths can contribute under the required design strategy.
A load path is a sequence of members and connections that transfers actions to support.
Scope. The alternate arrows are an explanation, not proof that the remaining members or connections can carry redistributed actions.
Check and takeaway. Strength, overall stability and robustness answer different questions. State which question each check addresses.
Apply the reasoning to this section’s data and conditions
Source: Chapter 1 pp.14–15.
Strength checks compare member/connection demand with resistance.
Overall stability prevents overturning, sliding, uplift or uncontrolled sway.
Bracing, moment-resisting joints, shear walls and cores can supply lateral resistance.
Robustness limits the spread of accidental local damage into disproportionate collapse.
The source gives four robustness measures.
Provide vertical and horizontal tension ties.
Resist the minimum horizontal loads.
Provide alternative load paths after a vertical element is lost.
Design key elements for their specified actions.
Each measure addresses a failure mechanism.
A tie can maintain continuity after a support is lost.
An alternative load path lets surrounding members carry redistributed action.
The notes do not give a numerical tie-force design example.
Therefore, this section does not invent one.
Mechanism detailsUnderstand an alternative load path
The complete mechanism is explained below.
Read each stage together with its stated conditions; playback and interaction are not required.
- Gravity load passes through beams to their columns.
Local accidental damage interrupts one path.
The highlighted column fades to show the interrupted route.
- Ties and continuity can provide another load path, subject to design and deformation capacity.
This schematic explains the principle.
It does not prove that a particular frame survives column removal.
16. Brittle fracture
A crack can fail without large yielding
Distinguish brittle fracture from the large deformation normally associated with ductile behaviour.
Prediction, then explanation. More severe stress concentration or less suitable toughness can increase fracture concern. Grade strength alone does not settle the question.
Brittle fracture can propagate with limited plastic deformation. Material toughness, temperature, thickness and detail conditions affect assessment.
Toughness concerns resistance to fracture. Ductility concerns deformation before fracture. Yield strength is a different property.
Scope. The sketch does not predict a critical crack size. Apply the supplied material-selection and detailing requirements.
Check and takeaway. A member can satisfy a nominal stress check yet still need a separate brittle-fracture assessment.
Apply the reasoning to this section’s data and conditions
Source: Chapter 1 p.15.
Brittle fracture is sudden cracking with little plastic deformation, associated with tensile stress.
The notes list welding, stress concentration, rapid load application, high stress, thick material and low temperature as factors increasing risk.
Select suitable steel quality/thickness and use sound welding practices.
For a short answer, describe the mechanism and give distinct influencing factors.
Do not confuse fatigue’s repeated crack growth with brittle fracture’s limited ductile warning.
Mechanism detailsBrittle fracture versus yielding
The complete mechanism is explained below.
Read each stage together with its stated conditions; playback and interaction are not required.
- A notch or weld detail can concentrate tensile stress.
- Steel quality, thickness, low temperature and rapid loading affect brittle-fracture susceptibility.
Brittle fracture can occur with little plastic warning.
It is distinct from progressive fatigue crack growth.
Follow the required steel quality and welding requirements.
The animation is qualitative, without an invented fracture threshold.
17. Deflection limits: select the correct row
Use the same mechanism: A safe beam can still sag too far. For the same UDL and stiffness, doubling span multiplies deflection by sixteen. Doubling I halves deflection.
Apply the reasoning to this section’s data and conditions
Source: Chapter 1 pp.16–17, Table 5.1; Data File p.2.
The course commonly checks the additional deflection due to unfactored imposed load.
For a simply supported beam carrying plaster or brittle finishes, limit = .
For other beams (excluding purlins and sheeting rails), .
Cantilevers use in the supplied table.
Purlins/sheeting rails must suit their cladding.
The full table also includes construction-stage sheeting, composite slabs, frame drift and crane runway limits.
The slide summary “” corresponds to a particular frame displacement row; relative inter-storey drift is a different row ( in the original extract).
Always write which displacement and which load condition you are checking.
The notes describe limits as advisory and subject to finishes/cladding requirements; in these exam problems use the supplied stated finish condition.
Prediction and explained answer.
A beam has factored imposed load but the original characteristic imposed load is .
Which enters the usual course deflection formula?
Answer and reasoning
.
The factor belongs to ULS demand.
The serviceability check uses the unfactored imposed load.
Mechanism detailsSee stiffness and deflection
The complete mechanism is explained below.
Read each stage together with its stated conditions; playback and interaction are not required.
Use the specified SLS load, span and support arrangement.
The demonstrator has a full-span UDL.
The loaded beam bends.
The deformation is exaggerated so its shape can be seen.
For a simply supported full-span UDL, .
Double L with w, E and I unchanged: δ becomes 16 times as large.
The readout uses , and .
Select the finish/support-specific limit from the original table.
18. Design strength depends on thickness
A table value has conditions
Find a design property without mixing a row, column or standard from a different case.
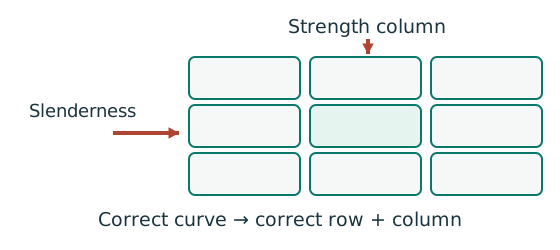
Prediction, then explanation. A different flange thickness can select a lower design strength even when the steel grade name remains unchanged.
Match the complete section designation. Read the relevant axis and unit. For strength tables, select material, thickness and curve before interpolating.
Given values come from the question. Lookup values come from a named table. Assumed values require an explicit condition.
Scope. A missing row or omitted restraint cannot be recovered from a schematic’s scale. Keep the result conditional when required data are absent.
Check and takeaway. Record the table, row, column and unit beside the substitution. That makes a later check possible.
Use the same mechanism: Separate stiffness, strength and ductility. Raising the yield level alone need not change the initial slope. The same elastic load can therefore give similar deformation.
Apply the reasoning to this section’s data and conditions
Physical interpretation: S355 does not always mean 355
Use the grade name to select the material column.
Read the design strength from the applicable thickness row.
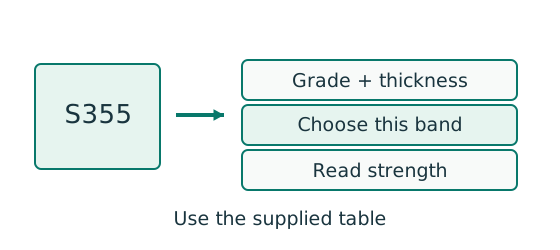
Sketch, not to scale; use the original dimensions.
- Identify the thickness that governs this check.
- Read the matching thickness band within the correct grade.
- Use that strength consistently in the calculation.
Remember: For the supplied S355 table, thickness above 16 mm can reduce .
Source: Chapter 1 Tables 3.2/3.3 on pp.18–19; Data File p.1.
For S355 in the supplied table:
| Thickness interval | () |
|---|---|
For beam bending, use the flange thickness to select as the lecture examples do.
For a plate, use that plate’s thickness.
For web bearing, is the web design strength.
Distinguish the material design strength from the bolt shear strength , weld strength , column compressive strength , and LTB bending strength .
All have stress units but answer different failure questions.
Prediction and explained answer.
Which strength applies to S355 cover plates thick and a main plate thick?
Answer and reasoning
Cover: because .
Main: because .
Do not use one value just because both say S355.
Mechanism detailsRead a table without losing the keys
The complete mechanism is explained below.
Read each stage together with its stated conditions; playback and interaction are not required.
- Name the required property: material strength, section property, buckling strength or a moment factor.
- Keep section size, steel grade, thickness band, curve and axis as separate lookup keys.
, and require different conversion powers.
Do not use adjacent columns interchangeably.
Use bracketing rows within the same valid column.
The original page remains the source of all table values.
Mechanism detailsRead a table without losing the keys
The complete mechanism is explained below.
Read each stage together with its stated conditions; playback and interaction are not required.
- Name the required property: material strength, section property, buckling strength or a moment factor.
- Keep section size, steel grade, thickness band, curve and axis as separate lookup keys.
, and require different conversion powers.
Do not use adjacent columns interchangeably.
Use bracketing rows within the same valid column.
The original page remains the source of all table values.
19. Local buckling and the four classes
Find which plate buckles first
Before using plastic bending resistance, check whether the flange and web can sustain the required stress distribution.
Prediction, then explanation. At fixed width, a thinner plate has a larger width-to-thickness ratio. Local buckling then becomes more restrictive.
Calculate the flange and web ratios separately. Compare each with the limits for its stress condition. The worse class governs.
py is the design yield strength in N/mm². ε is a dimensionless scale used in the supplied classification limits.
Scope. Pure bending and uniform compression use different web limits. Class 2 allows plastic resistance but not the Class 1 rotation capability.
Check and takeaway. A Class 1 web and Class 2 flange give a Class 2 section. Do not average the class numbers.
Apply the reasoning to this section’s data and conditions
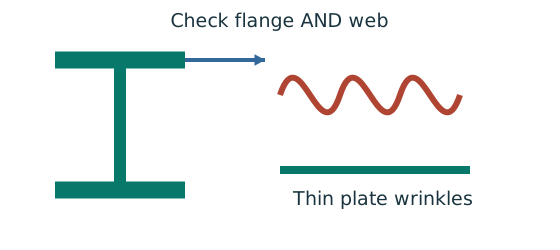
Physical interpretation: A thin part can wrinkle first
A thin plate may wrinkle before the whole steel member reaches its intended resistance.
Sketch, not to scale; use the original dimensions.
- Check flange and web slenderness using their own definitions.
- Compare each ratio with the correct class limits.
- The element with the more restrictive class determines the section class.
Remember: Bending limits and uniform-compression limits are different.
Source: Chapter 1 pp.19–22; Data File p.1.
A thin plate can buckle locally before the whole member buckles sideways.
Classification checks element width/depth divided by thickness.
The least favourable element controls the whole cross section: Class 2 flange plus Class 3 web gives Class 3.
“Lowest class” in lecture prose means worst behaviour, hence highest class number.
| Class | What can be developed? | Exam implication |
|---|---|---|
| 1: plastic | Full plastic moment and enough rotation for a plastic hinge | Plastic analysis permitted where otherwise applicable. |
| 2: compact | Full plastic moment but limited rotation | May use plastic section resistance, not assume redistribution capability. |
| 3: semi-compact | Extreme fibre can reach ; local buckling limits plastic spreading | Use elastic resistance or explicitly permitted effective properties. |
| 4: slender | Local buckling can occur before extreme fibre reaches | Effective/reduced section treatment required; gross Class 1 formulas do not apply. |
For a rolled I/H beam in major-axis bending, use Table 7.1 “outstand flange, compression due to bending, rolled section” and “web, neutral axis at mid-depth”.
Flange limits are , and for Classes 1, 2 and 3.
Web limits are , and .
The supplied section tables already tabulate and .
Do not replace clear web depth with overall depth .
For a web under combined compression and bending, use the general-web row and its parameter.
The course is limited to the interval to .
For positive , the Class limit is , with the table’s lower bound .
For example, an initially calculated of 2.06 is limited to : .
Pure-compression non-slender checks use flange and web as in the column examples; they do not prove Class rotation capacity.
A separate web slenderness check in the beam examples screens the need for shear-buckling treatment.
It is not the Class 1 bending-web limit , and it does not replace concentrated-load web bearing/buckling checks.
Prediction and explained answer.
For S355 with , a rolled beam has and .
Find its bending class.
Answer and reasoning
and : flange is Class 2.
: web is Class 1.
Overall Class 2.
The flange controls.
Mechanism detailsWhy thin elements buckle locally
The complete mechanism is explained below.
Read each stage together with its stated conditions; playback and interaction are not required.
- The flange outstand and web have different widths, thicknesses and edge support conditions.
- A thinner plate can wrinkle locally before the complete member loses stability.
Class 1 allows plastic rotation.
Class 2 reaches plastic resistance.
Class 3 reaches elastic resistance.
Class 4 requires effective properties.
Check every relevant compression element with the supplied limits and stress distribution.
The deformation shown is qualitative.
Mechanism detailsWhy thin elements buckle locally
The complete mechanism is explained below.
Read each stage together with its stated conditions; playback and interaction are not required.
- The flange outstand and web have different widths, thicknesses and edge support conditions.
- A thinner plate can wrinkle locally before the complete member loses stability.
Class 1 allows plastic rotation.
Class 2 reaches plastic resistance.
Class 3 reaches elastic resistance.
Class 4 requires effective properties.
Check every relevant compression element with the supplied limits and stress distribution.
The deformation shown is qualitative.
20. Course scope and standards: avoid mixed methods
Use the same mechanism: A table value has conditions. A different flange thickness can select a lower design strength even when the steel grade name remains unchanged.
Apply the reasoning to this section’s data and conditions
The lecture explicitly uses the Hong Kong Code of Practice for the Structural Use of Steel 2011 for calculations (Chapter 1 p.7).
The July 2026 module syllabus lists “2011 (2023 Edition)” as a reference.
The supplied Data File says its tables reproduce the 2011 Code and its section properties come from an older SCI/BS 5950 design guide.
Course exercises on this site follow those supplied formulas, tables and symbols.
A bibliography entry does not authorise replacing their coefficients with those of another standard.
Chapter 1 pp.23–26 introduces BS 5950, GB 50017, Eurocode 3, AS 4100 and AISC, and contrasts notation.
EN 1990 gives the design basis.
EN 1991 covers actions.
Material codes cover concrete (1992), steel (1993), composite construction (1994), timber (1995) and masonry (1996).
EN 1997 covers geotechnical design.
EN 1998 covers earthquake resistance.
EN 1999 covers aluminium.
A national implementation includes the unaltered Eurocode.
It can also include a National Annex.
That annex specifies Nationally Determined Parameters where the Eurocode permits choices.
| Meaning | Course HK notation | Eurocode notation in the lecture |
|---|---|---|
| Major cross-section axis | ||
| Minor cross-section axis | ||
| Along member | Not labelled in this course table | |
| Elastic section modulus | ||
| Plastic section modulus | ||
| Axial action | ||
| Design yield stress | ||
| Column compressive strength | ||
| LTB bending strength |
Dead load is called permanent action; imposed and wind loads are variable actions in the lecture comparison.
Its Eurocode loading example uses and with combination factors.
Those values are an overview topic only.
Do not put them into the HK worked solutions.
The p.26 label “Wrapping Index” is a source typo for warping; retain the table’s intended warping/torsion distinction when reading properties.
Mechanism detailsRead a table without losing the keys
The complete mechanism is explained below.
Read each stage together with its stated conditions; playback and interaction are not required.
- Name the required property: material strength, section property, buckling strength or a moment factor.
- Keep section size, steel grade, thickness band, curve and axis as separate lookup keys.
, and require different conversion powers.
Do not use adjacent columns interchangeably.
Use bracketing rows within the same valid column.
The original page remains the source of all table values.
Unnumbered lecture arithmetic: combination coefficients
Use the same mechanism: Find the missing factor. At fixed strength, doubling the force requires twice the area. The equation should preserve that relationship.
Apply the reasoning to this section’s data and conditions
Source: Chapter 1 p.25, Table 11.
This comparison explicitly assumes for wind and for imposed load.
is a dimensionless accompanying-action factor, multiplied by the dimensionless action factor.
Accompanying wind coefficient
Use the same mechanism: Find the missing factor. At fixed strength, doubling the force requires twice the area. The equation should preserve that relationship.
Apply the reasoning to this section’s data and conditions
Mechanism detailsRearrange a capacity equation
The complete mechanism is explained below.
Read each stage together with its stated conditions; playback and interaction are not required.
For , P is force, p is stress and A is area.
Here we want A.
- Divide both sides by the same non-zero stress p.
- The p on the right cancels, leaving .
gives .
This is required area, not a selected section or a complete design check.
Accompanying imposed coefficient
Use the same mechanism: Find the missing factor. At fixed strength, doubling the force requires twice the area. The equation should preserve that relationship.
Apply the reasoning to this section’s data and conditions
Mechanism detailsRearrange a capacity equation
The complete mechanism is explained below.
Read each stage together with its stated conditions; playback and interaction are not required.
For , P is force, p is stress and A is area.
Here we want A.
- Divide both sides by the same non-zero stress p.
- The p on the right cancels, leaving .
gives .
This is required area, not a selected section or a complete design check.
Thus the two displayed illustrative combinations contain and respectively.
These are not unfactored loads, not steel strengths and not alternative HK gravity coefficients.
For the HK floor exercises return to .
Prediction and explained answer.
Under those illustrative assumptions only, what accompanies a wind action?
Answer and reasoning
.
This answer belongs to the lecture’s Eurocode comparison, not the HK worked-example loading method.
Mechanism detailsRearrange a capacity equation
The complete mechanism is explained below.
Read each stage together with its stated conditions; playback and interaction are not required.
For , P is force, p is stress and A is area.
Here we want A.
- Divide both sides by the same non-zero stress p.
- The p on the right cancels, leaving .
gives .
This is required area, not a selected section or a complete design check.
Mechanism detailsRearrange a capacity equation
The complete mechanism is explained below.
Read each stage together with its stated conditions; playback and interaction are not required.
For , P is force, p is stress and A is area.
Here we want A.
- Divide both sides by the same non-zero stress p.
- The p on the right cancels, leaving .
gives .
This is required area, not a selected section or a complete design check.
Practise this chapter: tutorials, assignments and past-paper answers →
Recent-paper practice for this chapter
- 2024 PTE · Compulsory floor beams
- 2023 FT/PTD · 2023 AQ1 — floor beams and fire protection
- 2023 PTE · Compulsory floor beams
- 2022 FT/PTDR · 2022 AQ1 — floor beams and fire protection