Crash course · 0
Core skills: the eight tools every question uses This page is the foundation of the whole crash course. Every question type later simply combines these tools. Take your time on the first read; each section ends with a quick check.
Print page Show all answers
On this page 1. Units: where most mistakes happen 2. Loads: dead, imposed and the load factors 3. Reactions, shear and bending moment 4. Reading the section tables (Data File) 5. Design strength p y p_y p y 6. Classification: will a thin plate crumple first? 7. Interpolation: when your value falls between two table rows 8. Deflection: does it sag too much? 1. Units: where most mistakes happen★★★ Always examined In plain words
Steel calculations mix “big” units (kN, m) with “small” units (N, mm). An answer that is 1000 times wrong is rarely a misunderstanding; it is usually a unit that was not converted.
Quantity Usual units Conversion Force N, kN 1 kN = 1000 N 1\text{ kN}=1000\text{ N} 1 kN = 1000 N Length mm, m 1 m = 1000 mm 1\text{ m}=1000\text{ mm} 1 m = 1000 mm Stress / strength N/mm² (= MPa) force ÷ area Bending moment kN·m, N·mm 1 kN⋅m = 10 6 N⋅mm 1\text{ kN·m}=10^{6}\text{ N·mm} 1 kN⋅m = 1 0 6 N⋅mm Line load kN/m 1 kN/m = 1 N/mm 1\text{ kN/m}=1\text{ N/mm} 1 kN/m = 1 N/mm Area A A A cm² → mm² × 100 Section modulus S , Z S,\,Z S , Z cm³ → mm³ × 1000 Second moment of area I I I cm⁴ → mm⁴ × 10 000 (10 4 10^4 1 0 4
Two shortcuts worth memorising:
strength ( N/mm 2 ) × area ( mm 2 ) ÷ 1000 = force ( kN ) \text{strength}\,(\text{N/mm}^2)\times\text{area}\,(\text{mm}^2)\div 1000=\text{force}\,(\text{kN}) strength ( N/mm 2 ) × area ( mm 2 ) ÷ 1000 = force ( kN ) p y ( N/mm 2 ) × S ( cm 3 ) ÷ 1000 = moment ( kN⋅m ) p_y\,(\text{N/mm}^2)\times S\,(\text{cm}^3)\div 1000=\text{moment}\,(\text{kN·m}) p y ( N/mm 2 ) × S ( cm 3 ) ÷ 1000 = moment ( kN⋅m ) Why?
For the second one: S S S 355 × 1096 ÷ 1000 = 389.08 kN⋅m 355\times 1096\div 1000=389.08\text{ kN·m} 355 × 1096 ÷ 1000 = 389.08 kN⋅m
Exam tip
Use kN and m for loads, reactions and moments. Switch to N and mm for stresses, strengths and deflections. Write the conversion on the same line as the substitution so the marker can see you know what you are doing.
Quick check: Convert I = 21 370 cm 4 I=21\,370\text{ cm}^4 I = 21 370 cm 4 M = 350 kN⋅m M=350\text{ kN·m} M = 350 kN⋅m
Show answer I = 21 370 × 10 4 = 2.137 × 10 8 mm 4 I=21\,370\times 10^4=2.137\times10^{8}\text{ mm}^4 I = 21 370 × 1 0 4 = 2.137 × 1 0 8 mm 4 M = 350 × 10 6 = 3.5 × 10 8 N⋅mm M=350\times10^{6}=3.5\times10^{8}\text{ N·mm} M = 350 × 1 0 6 = 3.5 × 1 0 8 N⋅mm
2. Loads: dead, imposed and the load factors★★★ Always examined In plain words
A structure carries two kinds of weight. Dead load (G k G_k G k is always there: the slab, finishes and the beam’s own weight. Imposed load (Q k Q_k Q k changes: people and furniture. For design we enlarge both to leave a safety margin.
w design = 1.4 G k + 1.6 Q k w_{\text{design}}=1.4\,G_k+1.6\,Q_k w design = 1.4 G k + 1.6 Q k Why?
Imposed load is harder to predict (ten people today, a hundred tomorrow), so it gets the bigger factor (1.6). Dead load is better known (1.4).
From slab thickness to kN/m² g k = thickness ( m ) × unit weight ( kN/m 3 ) + finishes ( kN/m 2 ) g_k=\text{thickness}\,(\text{m})\times\text{unit weight}\,(\text{kN/m}^3)+\text{finishes}\,(\text{kN/m}^2) g k = thickness ( m ) × unit weight ( kN/m 3 ) + finishes ( kN/m 2 ) Example: 180 mm slab, 24.5 kN/m³ concrete, 0.4 kN/m² finishes: g k = 0.18 × 24.5 + 0.4 = 4.81 kN/m 2 g_k=0.18\times24.5+0.4=4.81\text{ kN/m}^2 g k = 0.18 × 24.5 + 0.4 = 4.81 kN/m 2
From kN/m² (area load) to kN/m (line load): the tributary width Everyday picture
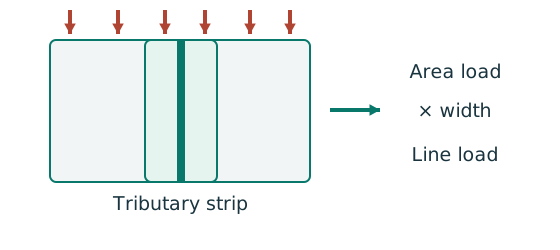
When it rains, each gutter collects only the strip of roof nearest to it, up to halfway to the next gutter. A beam is the same: it carries the slab up to halfway to the neighbouring beams. That strip is the tributary width .
w ( kN/m ) = area load ( kN/m 2 ) × tributary width ( m ) w\,(\text{kN/m})=\text{area load}\,(\text{kN/m}^2)\times\text{tributary width}\,(\text{m}) w ( kN/m ) = area load ( kN/m 2 ) × tributary width ( m ) Interior beam: half of the spacing on each side, s 1 2 + s 2 2 \tfrac{s_1}{2}+\tfrac{s_2}{2} 2 s 1 + 2 s 2 s 2 \tfrac{s}{2} 2 s Self-weight of the steel beam self-weight ( kN/m ) = mass ( kg/m ) × g 1000 \text{self-weight}\,(\text{kN/m})=\frac{\text{mass}\,(\text{kg/m})\times g}{1000} self-weight ( kN/m ) = 1000 mass ( kg/m ) × g Example: 39.1 kg/m with g = 10 g=10 g = 10 39.1 × 10 / 1000 = 0.391 kN/m 39.1\times10/1000=0.391\text{ kN/m} 39.1 × 10/1000 = 0.391 kN/m Where marks are lost
If the question says “factored”, “design” or “ultimate” load, it is already factored. Do not multiply by 1.4 or 1.6 again. A reaction passed from one beam to another is already factored if you factored the first beam. Do not factor it again. The slab span is not the tributary width. Look at the slab span arrows before deciding how much each beam carries. Quick check: A 150 mm slab, 24.5 kN/m³ concrete, 0.5 kN/m² finishes, 3 kN/m² imposed load. What is the design area load?
Show answer g k = 0.15 × 24.5 + 0.5 = 4.175 g_k=0.15\times24.5+0.5=4.175 g k = 0.15 × 24.5 + 0.5 = 4.175 = 1.4 × 4.175 + 1.6 × 3 = 5.845 + 4.8 = 10.645 kN/m 2 =1.4\times4.175+1.6\times3=5.845+4.8=10.645\text{ kN/m}^2 = 1.4 × 4.175 + 1.6 × 3 = 5.845 + 4.8 = 10.645 kN/m 2
3. Reactions, shear and bending moment★★★ Always examined In plain words
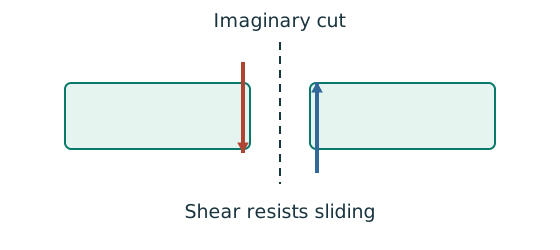
A reaction is the upward push of a support. Shear force (V V V tries to slide one part of the beam past the other. Bending moment (M M M tries to bend it. In a check we need the largest V V V M M M
Everyday picture
Rest a ruler on two fingers and put a book in the middle. The ruler sags (bending moment), and near your fingers it feels as if it could be “cut” (shear). Moment is largest in the middle; shear is largest at the ends.
Two standard cases to learn by heart (simply supported beam) Load Each reaction = maximum shear Maximum moment (midspan) Full-span uniform load (UDL) w w w w L 2 \dfrac{wL}{2} 2 w L w L 2 8 \dfrac{wL^2}{8} 8 w L 2 Point load P P P P 2 \dfrac{P}{2} 2 P P L 4 \dfrac{PL}{4} 4 P L
When both act and both maxima are at midspan, simply add them: M max = P L 4 + w L 2 8 M_{\max}=\tfrac{PL}{4}+\tfrac{wL^2}{8} M m a x = 4 P L + 8 w L 2
Load not in the middle? Take moments Take moments about the left support A to find R B R_B R B
R B L = ∑ P i a i + w L ⋅ L 2 R_B\,L=\sum P_i\,a_i+wL\cdot\frac{L}{2} R B L = ∑ P i a i + w L ⋅ 2 L Use vertical equilibrium for R A R_A R A
R A = total load − R B R_A=\text{total load}-R_B R A = total load − R B The maximum moment is where the shear changes from positive to negative (usually under a point load)
M ( x ) = R A x − w x 2 2 − ∑ P i ( x − a i ) ( loads left of x only ) M(x)=R_A\,x-\frac{w x^2}{2}-\sum P_i\,(x-a_i)\quad(\text{loads left of }x\text{ only}) M ( x ) = R A x − 2 w x 2 − ∑ P i ( x − a i ) ( loads left of x only ) Rules for drawing shear-force (SFD) and bending-moment (BMD) diagrams Under a UDL: the SFD is a sloping straight line and the BMD is a curve. At a point load: the SFD jumps by the size of the load and the BMD has a sharp corner. At a simple support: moment = 0. Where shear = 0 (or changes sign) → maximum moment. Exam tip
Always label the key values on the diagrams: reactions, the shear on each side of every load, and the moment under every point load. These are the easiest marks in the paper.
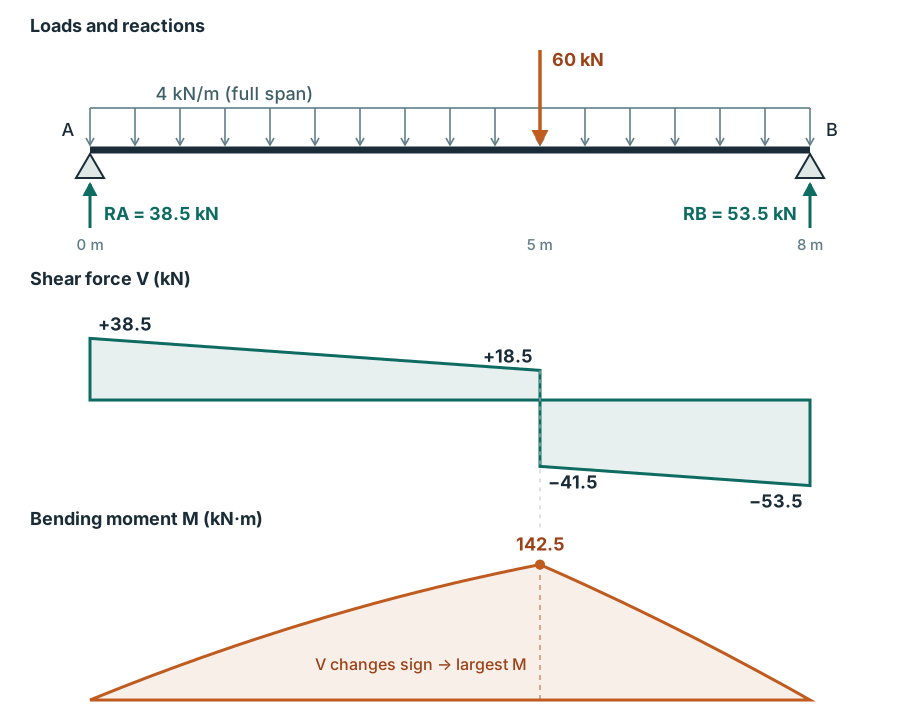
Quick check: An 8 m simply supported beam carries 60 kN at 5 m from A plus 4 kN/m over the full span. Find the reactions.
Hint Take moments about A so that A’s own reaction drops out of the equation.
Show answer R B = 60 × 5 + ( 4 × 8 ) × 4 8 = 53.5 kN R_B=\dfrac{60\times5+(4\times8)\times4}{8}=53.5\text{ kN} R B = 8 60 × 5 + ( 4 × 8 ) × 4 = 53.5 kN R A = 60 + 32 − 53.5 = 38.5 kN R_A=60+32-53.5=38.5\text{ kN} R A = 60 + 32 − 53.5 = 38.5 kN
Past-paper walkthrough
Full example: the shear-force and bending-moment diagrams of this 8 m beam
Walk from left to right: the shear falls slowly from +38.5, then jumps to −41.5 under the 60 kN load; the moment is largest at that point. Position Shear (left / right, kN) Moment (kN·m) A (0 m) 0 / +38.5 0 Under 60 kN (5 m) +18.5 / −41.5 142.5 (max)B (8 m) −53.5 / 0 0
V 5 − = 38.5 − 4 × 5 = 18.5 kN V_{5^-}=38.5-4\times5=18.5\text{ kN} V 5 − = 38.5 − 4 × 5 = 18.5 kN V 5 + = 18.5 − 60 = − 41.5 kN V_{5^+}=18.5-60=-41.5\text{ kN} V 5 + = 18.5 − 60 = − 41.5 kN V B = − 41.5 − 4 × 3 = − 53.5 kN V_{B}=-41.5-4\times3=-53.5\text{ kN} V B = − 41.5 − 4 × 3 = − 53.5 kN M 5 = 38.5 × 5 − 4 × 5 2 2 = 192.5 − 50 = 142.5 kN⋅m M_{5}=38.5\times5-\frac{4\times5^2}{2}=192.5-50=142.5\text{ kN·m} M 5 = 38.5 × 5 − 2 4 × 5 2 = 192.5 − 50 = 142.5 kN⋅m Check: the shear at B, −53.5 kN, equals R B R_B R B M 5 = 53.5 × 3 − 4 × 3 2 2 = 142.5 M_5=53.5\times3-\tfrac{4\times3^2}{2}=142.5 M 5 = 53.5 × 3 − 2 4 × 3 2 = 142.5
Concept map
Load path: from the weight of the slab to the shear and moment diagrams
Every calculation question starts on this route: area load → load per metre → reactions → shear → moment → compare with capacity. Where the maximum moment is, and how a reaction passes to the next member, are both on this map.
▶ Guided tour Reset
Area load (kN/m²) b b b Tributary width ! Where marks are lost w w w Load per metre of beam Free-body diagram: draw one beam on its own R A R_A R A , R B R_B R B Reactions: take moments ! Where marks are lost V V V Shear-force diagram M M M Bending-moment diagram ! Where marks are lost Shear changes sign → maximum moment ! Where marks are lost A reaction becomes the next member’s load ! Where marks are lost Demand ≤ capacity Exam: label every value
! marks are often lost hereText version (from cause to result)
Cause
Area load (kN/m²)
The slab’s dead and imposed loads per square metre. For design they are factored: 1.4 g k + 1.6 q k 1.4g_k+1.6q_k 1.4 g k + 1.6 q k
Comes from (upstream) — (a starting point)
Leads to (downstream) w w w Load per metre of beam
What changes it Where marks are lost
b b b Tributary width
The strip of slab whose load reaches a beam. With equal spacing s s s s / 2 s/2 s /2 s s s s / 2 s/2 s /2
Comes from (upstream) — (a starting point)
Leads to (downstream) w w w Load per metre of beam
Key idea
w w w Load per metre of beam
Area load × tributary width gives the load along each metre of beam (kN/m), plus the beam’s self-weight.
Comes from (upstream) Area load (kN/m²) b b b Tributary width
Leads to (downstream) R A R_A R A , R B R_B R B Reactions: take moments
Key idea
Free-body diagram: draw one beam on its own
Replace the surroundings with support reactions. A pin stops movement but allows rotation; a roller gives one reaction at right angles to its surface; a lateral restraint is not a vertical support.
Comes from (upstream) — (a starting point)
Leads to (downstream) R A R_A R A , R B R_B R B Reactions: take moments
Key idea Where marks are lost
R A R_A R A , R B R_B R B Reactions: take moments
Take moments about one support for the other reaction, then use vertical equilibrium. For overall equilibrium a UDL can be replaced by one force w L wL w L
Formula
∑ M A = 0 ∑ F y = 0 \textstyle\sum M_A=0\qquad\sum F_y=0 ∑ M A = 0 ∑ F y = 0 Where marks are lost
Not checking R A + R B = R_A+R_B= R A + R B =
Comes from (upstream) w w w Load per metre of beam Free-body diagram: draw one beam on its own
Leads to (downstream) V V V Shear-force diagram A reaction becomes the next member’s load
Key idea
V V V Shear-force diagram
Cut the beam anywhere: the sum of all forces left of the cut is the shear. It jumps at a point load and slopes under a UDL.
Comes from (upstream) R A R_A R A , R B R_B R B Reactions: take moments
Leads to (downstream) M M M Bending-moment diagram Shear changes sign → maximum moment Demand ≤ capacity
Key idea Where marks are lost
M M M Bending-moment diagram
Moments about the cut of all forces to its left. The change in moment = the area under the shear diagram: a parabola under a UDL, a sharp corner at a point load.
Where marks are lost
Units: moment is kN·m, shear is kN. w L 2 / 8 wL^2/8 w L 2 /8
Comes from (upstream) V V V Shear-force diagram
Leads to (downstream) Shear changes sign → maximum moment
Result Where marks are lost
Shear changes sign → maximum moment
Because the moment is the running area under the shear, it stops growing where the shear is zero (changes sign) — that is the maximum. Also check supports, load points and the root of any overhang.
Comes from (upstream) V V V Shear-force diagram M M M Bending-moment diagram
Leads to (downstream) Demand ≤ capacity
How design deals with it Where marks are lost
A reaction becomes the next member’s load
A beam-end reaction pushes up on that beam and down, by the same amount, on the member below: slab → secondary beam → main beam → column → foundation.
Where marks are lost
Drawing the reaction both up and down on the same beam (counting it twice), or factoring an already-factored reaction again.
Comes from (upstream) R A R_A R A , R B R_B R B Reactions: take moments
Leads to (downstream) Exam: label every value
How design deals with it
Demand ≤ capacity
The largest shear and moment are the “demand”, compared with V c V_c V c M c M_c M c M b M_b M b floor-beam map .
Comes from (upstream) V V V Shear-force diagram Shear changes sign → maximum moment
Leads to (downstream) Exam: label every value
Exam answer
Exam: label every value
Label the shear on both sides of every load point and the moment at every load point and the maximum; show the R A + R B R_A+R_B R A + R B
Comes from (upstream) Demand ≤ capacity A reaction becomes the next member’s load
Leads to (downstream) — (the last step)
Tour steps
1. From area load to load per metre
Area load × tributary width → load per metre (plus self-weight).
In this step Area load (kN/m²) b b b Tributary width w w w Load per metre of beam
2. Draw one beam, find the reactions
The free-body diagram shows only support reactions; take moments, then check the sum.
In this step Free-body diagram: draw one beam on its own R A R_A R A , R B R_B R B Reactions: take moments
3. Shear and moment
Shear = forces left of the cut; moment = area under the shear diagram.
Why?
So where the shear changes from positive to negative the moment stops growing — that is the maximum.
In this step V V V Shear-force diagram M M M Bending-moment diagram Shear changes sign → maximum moment
4. The load keeps travelling down
This beam’s reaction is the load the next member receives.
In this step A reaction becomes the next member’s load
5. Check it and write it up
Compare the largest V V V M M M
In this step Demand ≤ capacity Exam: label every value
4. Reading the section tables (Data File)★★★ Always examined In plain words
The exam gives you a Data File with the size and properties of every steel section. You do not memorise the numbers, but you must know what each symbol is used for .
A size such as 457×152×52 UB means roughly 457 mm deep, 152 mm wide and 52 kg per metre. These are nominal sizes; read the real depth from the table (this beam is actually 449.8 mm deep).
Symbol Meaning Used for D D D overall depth shear area A v = t D A_v=tD A v = t D t t t T T T web thickness / flange thickness T T T p y p_y p y b / T b/T b / T d / t d/t d / t flange and web slenderness ratios classification (section 6) I x I_x I x second moment of area: stiffness against bending deflection Z x Z_x Z x elastic section modulus the 1.2 p y Z 1.2p_yZ 1.2 p y Z S x S_x S x plastic section modulus moment capacity p y S p_yS p y S r x , r y r_x,\,r_y r x , r y radius of gyration slenderness λ = L E / r \lambda=L_E/r λ = L E / r u u u x x x buckling parameter, torsional index LTB calculation A A A cross-section area column capacity P c = A p c P_c=Ap_c P c = A p c
Everyday picture
A ruler standing on its edge is hard to bend; lying flat it bends easily. A section likewise has a strong (major) axis x – x x\text{–}x x – x y – y y\text{–}y y – y x x x I x , Z x , S x I_x,\,Z_x,\,S_x I x , Z x , S x
Data File page Contents p.1 design strength p y p_y p y p.2 beam, tension and compression formulas; deflection limits p.3 column interaction formulas; weld formulas p.4 bolt areas and strengths; bearing formulas p.5 Table 8.3a: LTB bending strength p b p_b p b p.6 Table 8.4: LTB equivalent moment factor m L T m_{LT} m L T p.7 Table 8.7 strut-curve selection; Table 8.9 moment factor m m m p.8 Table 8.8: compressive strength p c p_c p c p.9–11 UB and UC dimensions and properties p.12 unequal angles
Where marks are lost
Do not use the 457 in the name as D D D I I I Z Z Z S S S Read along the same row: dimensions are on p.9 and properties on p.10. Make sure both are for the same section. 5. Design strength p y p_y p y ★★★ Always examined In plain words
S355 does not always mean p y = 355 p_y=355 p y = 355 thickest part (for an I-section usually the flange thickness T T T
Thickness up to S275 S355 16 mm 275 355 40 mm 265 345 63 mm 255 335 80 mm 245 325 100 mm 235 315
Example: a 610×229×140 UB has flange T = 22.1 mm T=22.1\text{ mm} T = 22.1 mm p y = 345 N/mm 2 p_y=345\text{ N/mm}^2 p y = 345 N/mm 2
Why?
Thick plates cool more slowly during rolling, so their grain is coarser and their strength a little lower. The exam will not ask why, but it will take marks for the wrong number.
Quick check: What is p y p_y p y
Show answer Cover plate 355 (12 ≤ 16 12\le16 12 ≤ 16 16 < 20 ≤ 40 16<20\le40 16 < 20 ≤ 40
6. Classification: will a thin plate crumple first?★★★ Always examined In plain words
A section is made of plates (flanges and web). If a plate is too thin, it wrinkles locally (local buckling) before the steel reaches its full strength. Classification checks whether the plates are “chunky” enough.
Everyday picture
Press down on an empty drink can and its thin wall crumples. A thick steel tube would not. The smaller b / T b/T b / T d / t d/t d / t
ε = 275 p y ( p y = 355 ⇒ ε = 0.880 ; p y = 345 ⇒ ε = 0.893 ) \varepsilon=\sqrt{\frac{275}{p_y}}\qquad(p_y=355\Rightarrow\varepsilon=0.880;\;p_y=345\Rightarrow\varepsilon=0.893) ε = p y 275 ( p y = 355 ⇒ ε = 0.880 ; p y = 345 ⇒ ε = 0.893 ) Element (rolled I-section in bending) Class 1 plastic Class 2 compact Class 3 semi-compact flange b / T ≤ b/T\le b / T ≤ 9 ε 9\varepsilon 9 ε 10 ε 10\varepsilon 10 ε 15 ε 15\varepsilon 15 ε web d / t ≤ d/t\le d / t ≤ 80 ε 80\varepsilon 80 ε 100 ε 100\varepsilon 100 ε 120 ε 120\varepsilon 120 ε
Work out ε \varepsilon ε
Use the p y p_y p y
Flange: compare b / T b/T b / T 9 ε , 10 ε , 15 ε 9\varepsilon,10\varepsilon,15\varepsilon 9 ε , 10 ε , 15 ε
Web: compare d / t d/t d / t 80 ε , 100 ε , 120 ε 80\varepsilon,100\varepsilon,120\varepsilon 80 ε , 100 ε , 120 ε
Take the worse result (the higher class number)
For example flange Class 2 and web Class 1 → the section is Class 2.
Remember
Class 1 or 2 → moment capacity may use the plastic modulus S S S M c = min ( p y S , 1.2 p y Z ) M_c=\min(p_yS,\;1.2p_yZ) M c = min ( p y S , 1.2 p y Z ) Class 3 → only the elastic modulus Z Z Z M c = p y Z M_c=p_yZ M c = p y Z The usual exam UB/UC sections are almost always Class 1, but you still need to show the comparison to earn the marks. Understanding map
p y p_y p y
p y p_y p y
▶ Guided tour Hide the numbers (test yourself) Reset
S355 \text{S355} S355 Steel grade T T T = 10.7 mm Flange thickness b / T b/T b / T = 5.89 Flange ratio d / t d/t d / t = 47.2 Web ratio p y p_y p y = 355 Design strength ! Where marks are lost ε \varepsilon ε = 0.880 Strength factor b / T ≤ 9 ε b/T\le9\varepsilon b / T ≤ 9 ε Class 1 Flange class d / t ≤ 80 ε d/t\le80\varepsilon d / t ≤ 80 ε Class 1 Web class Class \text{Class} Class = 1 Section class ! Where marks are lost d / t ≤ 70 ε d/t\le70\varepsilon d / t ≤ 70 ε 47.2 < 61.6 Shear-buckling check M c M_c M c Moment capacity V c V_c V c Shear capacity β w \beta_w β w Section factor for LTB p b p_b p b , p c p_c p c Which column of the buckling tables
! marks are often lost hereText version (in working order)
From the question
S355 \text{S355} S355 Steel grade
The question states S275 or S355. It is only the starting point for p y p_y p y p y p_y p y
Needs (upstream) — (a starting value)
Used for (downstream) p y p_y p y Design strength
From the tables
T T T Flange thickness
The thickest part of the section (usually the flange of an I-section), used to read p y p_y p y
Where it comes from: Section table.
Needs (upstream) — (a starting value)
Used for (downstream) p y p_y p y Design strength
Worked out Where marks are lost
p y p_y p y Design strength
Thicker steel is slightly weaker. S355: T ≤ 16 T\le16 T ≤ 16 16 < T ≤ 40 16<T\le40 16 < T ≤ 40
2024 Q1 (B1)
T = 10.7 ≤ 16 ⇒ p y = 355 N/mm 2 T=10.7\le16\;\Rightarrow\;p_y=355\text{ N/mm}^2 T = 10.7 ≤ 16 ⇒ p y = 355 N/mm 2 Needs (upstream) S355 \text{S355} S355 Steel grade T T T Flange thickness
Used for (downstream) ε \varepsilon ε Strength factor M c M_c M c Moment capacity V c V_c V c Shear capacity p b p_b p b , p c p_c p c Which column of the buckling tables
From the tables
b / T b/T b / T Flange ratio
Flange outstand ÷ thickness. The smaller, the chunkier and the less likely to wrinkle.
Where it comes from: Already worked out in the section table.
Needs (upstream) — (a starting value)
Used for (downstream) b / T ≤ 9 ε b/T\le9\varepsilon b / T ≤ 9 ε Flange class
From the tables
d / t d/t d / t Web ratio
Clear web depth ÷ web thickness.
Where it comes from: Already worked out in the section table.
Needs (upstream) — (a starting value)
Used for (downstream) d / t ≤ 80 ε d/t\le80\varepsilon d / t ≤ 80 ε Web class d / t ≤ 70 ε d/t\le70\varepsilon d / t ≤ 70 ε Shear-buckling check
Worked out
ε \varepsilon ε Strength factor
Adjusts the class limits to this p y p_y p y
Formula
ε = 275 p y \varepsilon=\sqrt{\frac{275}{p_y}} ε = p y 275 2024 Q1 (B1)
275 / 355 = 0.880 \sqrt{275/355}=0.880 275/355 = 0.880 Needs (upstream) p y p_y p y Design strength
Used for (downstream) b / T ≤ 9 ε b/T\le9\varepsilon b / T ≤ 9 ε Flange class d / t ≤ 80 ε d/t\le80\varepsilon d / t ≤ 80 ε Web class d / t ≤ 70 ε d/t\le70\varepsilon d / t ≤ 70 ε Shear-buckling check
Worked out
b / T ≤ 9 ε b/T\le9\varepsilon b / T ≤ 9 ε Flange class
Within 9 ε 9\varepsilon 9 ε 10 ε 10\varepsilon 10 ε 15 ε 15\varepsilon 15 ε
2024 Q1 (B1)
5.89 < 9 × 0.880 = 7.92 ⇒ Class 1 5.89<9\times0.880=7.92\;\Rightarrow\;\text{Class 1} 5.89 < 9 × 0.880 = 7.92 ⇒ Class 1 Needs (upstream) b / T b/T b / T Flange ratio ε \varepsilon ε Strength factor
Used for (downstream) Class \text{Class} Class Section class
Worked out
d / t ≤ 80 ε d/t\le80\varepsilon d / t ≤ 80 ε Web class
Web in bending: within 80 ε 80\varepsilon 80 ε 100 ε 100\varepsilon 100 ε 120 ε 120\varepsilon 120 ε
2024 Q1 (B1)
47.2 < 80 × 0.880 = 70.4 ⇒ Class 1 47.2<80\times0.880=70.4\;\Rightarrow\;\text{Class 1} 47.2 < 80 × 0.880 = 70.4 ⇒ Class 1 Needs (upstream) d / t d/t d / t Web ratio ε \varepsilon ε Strength factor
Used for (downstream) Class \text{Class} Class Section class
Worked out Where marks are lost
Class \text{Class} Class Section class
Take the worse result (the higher number). E.g. flange Class 2, web Class 1 → Class 2.
Needs (upstream) b / T ≤ 9 ε b/T\le9\varepsilon b / T ≤ 9 ε Flange class d / t ≤ 80 ε d/t\le80\varepsilon d / t ≤ 80 ε Web class
Used for (downstream) M c M_c M c Moment capacity β w \beta_w β w Section factor for LTB
Worked out
d / t ≤ 70 ε d/t\le70\varepsilon d / t ≤ 70 ε Shear-buckling check
Not part of the classification; if it holds, the web will not wrinkle in shear and the simple shear formula applies.
2024 Q1 (B1)
47.2 < 70 × 0.880 = 61.6 47.2<70\times0.880=61.6 47.2 < 70 × 0.880 = 61.6 Needs (upstream) d / t d/t d / t Web ratio ε \varepsilon ε Strength factor
Used for (downstream) V c V_c V c Shear capacity
Capacity
M c M_c M c Moment capacity
Class 1 or 2 → min ( p y S x , 1.2 p y Z x ) \min(p_yS_x,1.2p_yZ_x) min ( p y S x , 1.2 p y Z x ) p y Z x p_yZ_x p y Z x floor beams and columns .
2024 Q1 (B1)
min ( 355 × 659 1000 , 1.2 × 355 × 576 1000 ) = 233.95 kN⋅m \min\!\left(\frac{355\times659}{1000},\;\frac{1.2\times355\times576}{1000}\right)=233.95\text{ kN·m} min ( 1000 355 × 659 , 1000 1.2 × 355 × 576 ) = 233.95 kN⋅m Needs (upstream) Class \text{Class} Class Section class p y p_y p y Design strength
Used for (downstream) — (the final conclusion)
Capacity
V c V_c V c Shear capacity
Uses p y p_y p y d / t ≤ 70 ε d/t\le70\varepsilon d / t ≤ 70 ε
Formula
V c = p y A v 3 × 1000 , A v = t D V_c=\frac{p_yA_v}{\sqrt3\times1000},\;A_v=tD V c = 3 × 1000 p y A v , A v = t D 2024 Q1 (B1)
355 × 2332.4 3 × 1000 = 478.06 kN \frac{355\times2332.4}{\sqrt3\times1000}=478.06\text{ kN} 3 × 1000 355 × 2332.4 = 478.06 kN Needs (upstream) d / t ≤ 70 ε d/t\le70\varepsilon d / t ≤ 70 ε Shear-buckling check p y p_y p y Design strength
Used for (downstream) — (the final conclusion)
Capacity
β w \beta_w β w Section factor for LTB
Class 1 or 2 → β w = 1 \beta_w=1 β w = 1 λ L T = u v λ \lambda_{LT}=uv\lambda λ L T = uv λ unrestrained beams (LTB) .
Needs (upstream) Class \text{Class} Class Section class
Used for (downstream) — (the final conclusion)
Capacity
p b p_b p b , p c p_c p c Which column of the buckling tables
Table 8.3a (p b p_b p b p c p_c p c p y p_y p y p y p_y p y
Needs (upstream) p y p_y p y Design strength
Used for (downstream) — (the final conclusion)
Tour steps
1. Copy three numbers
The grade, the flange thickness T T T b / T b/T b / T d / t d/t d / t
In this step S355 \text{S355} S355 Steel grade T T T Flange thickness b / T b/T b / T Flange ratio d / t d/t d / t Web ratio
2. p y p_y p y
10.7 mm ≤ 16 mm → 355.
Why?
Thick plates cool more slowly during rolling, so their grain is coarser and their strength a little lower.
In this step p y p_y p y Design strength
3. ε \varepsilon ε
ε = 275 / p y \varepsilon=\sqrt{275/p_y} ε = 275/ p y
In this step ε \varepsilon ε Strength factor
4. Compare flange and web separately
b / T b/T b / T 9 ε 9\varepsilon 9 ε d / t d/t d / t 80 ε 80\varepsilon 80 ε
In this step b / T ≤ 9 ε b/T\le9\varepsilon b / T ≤ 9 ε Flange class d / t ≤ 80 ε d/t\le80\varepsilon d / t ≤ 80 ε Web class
5. Take the worse class
Both Class 1 → the section is Class 1.
In this step Class \text{Class} Class Section class
6. While you are here: shear buckling
d / t ≤ 70 ε d/t\le70\varepsilon d / t ≤ 70 ε
In this step d / t ≤ 70 ε d/t\le70\varepsilon d / t ≤ 70 ε Shear-buckling check
7. One p y p_y p y
The bottom row shows where they go: M c M_c M c V c V_c V c β w \beta_w β w
Why?
That is why one wrong p y p_y p y
In this step M c M_c M c Moment capacity V c V_c V c Shear capacity β w \beta_w β w Section factor for LTB p b p_b p b , p c p_c p c Which column of the buckling tables
Note
A related check: d / t ≤ 70 ε d/t\le70\varepsilon d / t ≤ 70 ε
Quick check: S355 (p y = 355 p_y=355 p y = 355 b / T = 8.5 b/T=8.5 b / T = 8.5 d / t = 60 d/t=60 d / t = 60
Show answer 9 ε = 7.92 9\varepsilon=7.92 9 ε = 7.92 10 ε = 8.80 10\varepsilon=8.80 10 ε = 8.80 80 ε = 70.4 80\varepsilon=70.4 80 ε = 70.4
7. Interpolation: when your value falls between two table rows★★★ Always examined In plain words
A table only prints some rows (say λ = 60 \lambda=60 λ = 60 65 65 65 64.7 64.7 64.7
y = y 0 + x − x 0 x 1 − x 0 ( y 1 − y 0 ) y=y_0+\frac{x-x_0}{x_1-x_0}\,(y_1-y_0) y = y 0 + x 1 − x 0 x − x 0 ( y 1 − y 0 ) Example: λ L T = 64.70 \lambda_{LT}=64.70 λ L T = 64.70 60 → 251 60\to251 60 → 251 65 → 234 65\to234 65 → 234
p b = 251 + 64.70 − 60 65 − 60 × ( 234 − 251 ) = 251 + 0.940 × ( − 17 ) = 235.0 N/mm 2 p_b=251+\frac{64.70-60}{65-60}\times(234-251)=251+0.940\times(-17)=235.0\text{ N/mm}^2 p b = 251 + 65 − 60 64.70 − 60 × ( 234 − 251 ) = 251 + 0.940 × ( − 17 ) = 235.0 N/mm 2 Exam tip
Check: the answer must lie between the two table values (234 and 251). On the calculator, find the fraction first, then multiply by the difference.
Where marks are lost
Choose the right column first (correct p y p_y p y rows . Do not look up λ \lambda λ λ L T \lambda_{LT} λ L T 8. Deflection: does it sag too much?★★★ Always examined In plain words
Being strong enough is not the whole story. A beam that sags too much cracks the ceiling finishes and jams doors. So we also check deflection: how far the beam moves down.
δ UDL = 5 w L 4 384 E I δ midspan point load = P L 3 48 E I E = 205 000 N/mm 2 \delta_{\text{UDL}}=\frac{5wL^4}{384EI}\qquad\delta_{\text{midspan point load}}=\frac{PL^3}{48EI}\qquad E=205\,000\text{ N/mm}^2 δ UDL = 384 E I 5 w L 4 δ midspan point load = 48 E I P L 3 E = 205 000 N/mm 2 Remember
Use the unfactored imposed load only. No 1.4 or 1.6. Convert everything to N and mm: w w w P P P L L L I I I Limits: beams with plaster or other brittle finishes L / 360 L/360 L /360 L / 200 L/200 L /200 L / 180 L/180 L /180 Example (2024 beam B1): imposed q = 11.25 N/mm q=11.25\text{ N/mm} q = 11.25 N/mm L = 7000 mm L=7000\text{ mm} L = 7000 mm I = 10 170 × 10 4 mm 4 I=10\,170\times10^4\text{ mm}^4 I = 10 170 × 1 0 4 mm 4
δ = 5 × 11.25 × 7000 4 384 × 205 000 × 10 170 × 10 4 = 16.87 mm < 7000 360 = 19.44 mm ⇒ OK \delta=\frac{5\times11.25\times7000^4}{384\times205\,000\times10\,170\times10^4}=16.87\text{ mm}<\frac{7000}{360}=19.44\text{ mm}\;\Rightarrow\;\text{OK} δ = 384 × 205 000 × 10 170 × 1 0 4 5 × 11.25 × 700 0 4 = 16.87 mm < 360 7000 = 19.44 mm ⇒ OK Where marks are lost
Using the factored (1.4/1.6) load for deflection. Using L L L E E E The midspan point-load formula has L 3 L^3 L 3 L 4 L^4 L 4 ← Crash-course overview A. Floor beams (compulsory) →